Litecoin (LTC/USD) Market Is Converging in a Sideways Trend
Estimated Reading Time: 3 minutes
Don’t invest unless you’re prepared to lose all the money you invest. This is a high-risk investment and you are unlikely to be protected if something goes wrong. Take 2 minutes to learn more
Litecoin Price Prediction – May 23
A degree of technical dicey trading moments has surfaced in the LTC/USD trade as the crypto-economic market is converging in a sideways trend. The entire organization has been around the $90 price point. In the meantime, the two price shakers have had their capacity trading capped between $93.126550 and $90.450402, keeping a positive percentage rate of 1.22. When the current pressures eventually reach their highest resistance between the $95 and $100 levels, buyers may encounter the danger of engaging in pit-stop trading.
LTC/USD Market
Key Levels:
Resistance levels: $95, $105, $115
Support levels: $85, $80, $75
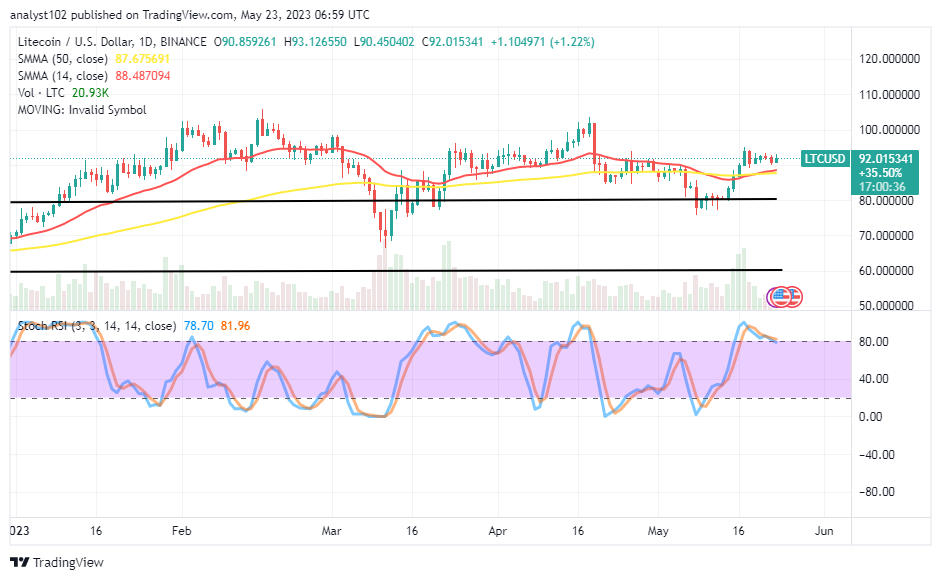
LTC/USD – Daily Chart
The LTC/USD daily chart reveals the crypto-economic market is converging in sideways forces at an axis not too away on the buy signal sides of the SMA trend lines. The 50-day SMA indicator is at $87.675691, clogging with the $88.487094 value of the 14-day SMA indicator. And those arrangements signify that a range trading event is ongoing. The Stochastic Oscillators have initially diverged maximally in the overbought region before slightly placing southbound to 81.96 and 78.70 levels.
Do the LTC/USD market bulls still have the ability to break out past the $100 barrier levels?
From a technical point of thought, the $100 resistance line will serve as a critical spot antagonizing the furtherance potential of long-position pushers in the LTC/USD trade as the crypto economy’s price converges in a sideways trend on the threshold of the $90 level. That sentiment leaves a discouraging position order in the presumed northward pushes afterward.
On the devaluation-moving direction of the technical analysis, as it has been by the reading of the Stochastic Oscillators, the price has reached an overbought state presently. Sellers should tighten their purse strings by keeping an alert over any probable aggressive motion from a rejection once the price has struck a resistance above the SMAs. A 4-hour and 1-hour complementary reading standpoint that is simultaneous may create a window of opportunity before obtaining a decent short entry.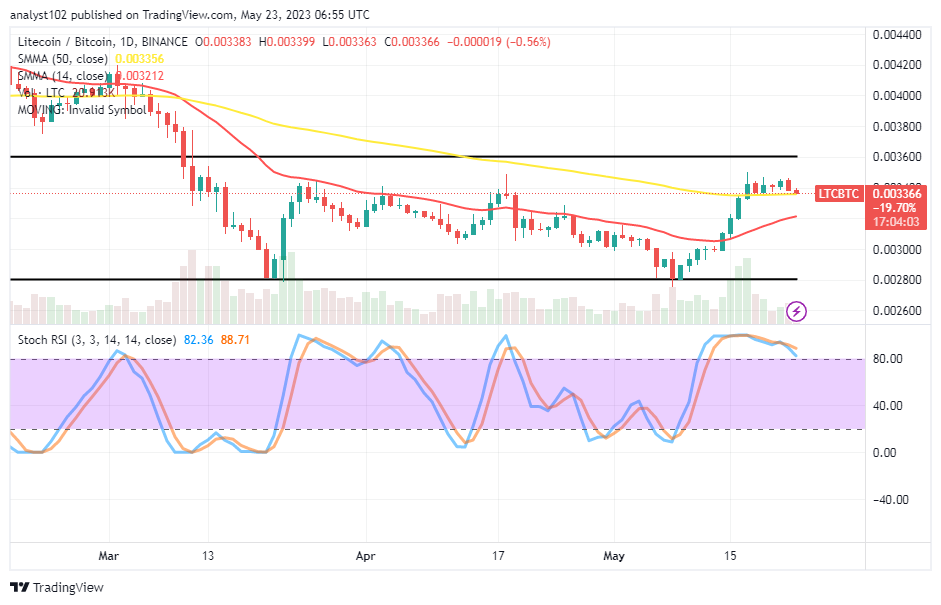
LTC/BTC Price Analysis
In contrast, Litecoin appears gently systemically succumbing to a decreasing force imposed on it by Bitcoin’s purchasing strength. The paired cryptocurrency market converges in a sideways trend at a zone just over the larger SMA. The 50-day SMA indicator is above the 14-day SMA I indicator. The Stochastic Oscillators have conjoined over fewer days in the overbought region. And they are now trying to cross southbound at 88.71 and 82.36. That signifies the subsequent forces are likely to counter the base crypto economy.
Note: Cryptosignals.org is not a financial advisor. Do your research before investing your funds in any financial asset or presented product or event. We are not responsible for your investing results.
You can purchase Lucky Block here. Buy LBLOCK