Bitcoin (BTC/USD) Trade Garners Vigor, Trading at $35,000
Estimated Reading Time: 3 minutes
Don’t invest unless you’re prepared to lose all the money you invest. This is a high-risk investment and you are unlikely to be protected if something goes wrong. Take 2 minutes to learn more
Bitcoin Price Prediction – November 8
There have been persistent uprising pressures in the Bitcoin market operations against the worth of the US coin, as the financial situation records that the crypto trade is garnering vigor, trading around the line of $35,000.
The market transaction lines have been consistently exhibiting higher lows during this technical piece, which has kept relative upward pressures within a range. The important indicator at $32,500, the underlying support, is a warning against any unheard-of downward move that would derail the present bullish trend. Buyers would need to continue showing up after the tumultuous sessions.
BTC/USD Market
Key Levels:
Resistance levels: $37,500, $40,000, $42,500
Support levels: $32,500, $30,000, $27,500
BTC/USD – Daily Chart
The BTC/USD daily chart reveals that the crypto-economic trade garners vigor, trading around the point of $35,000.
The Bollinger Band trend lines are northbound, positioning at $37,520.30; the middle line is at $33,931.23; and the lower part is at $30,342.16, respectively. The stochastic oscillators have managed to shift southward from 77.09 to 12.90. The positioning of the oscillators at the moment shows the bears have somewhat lost the probable signal toward pressing down the crypto’s values from around $35,000.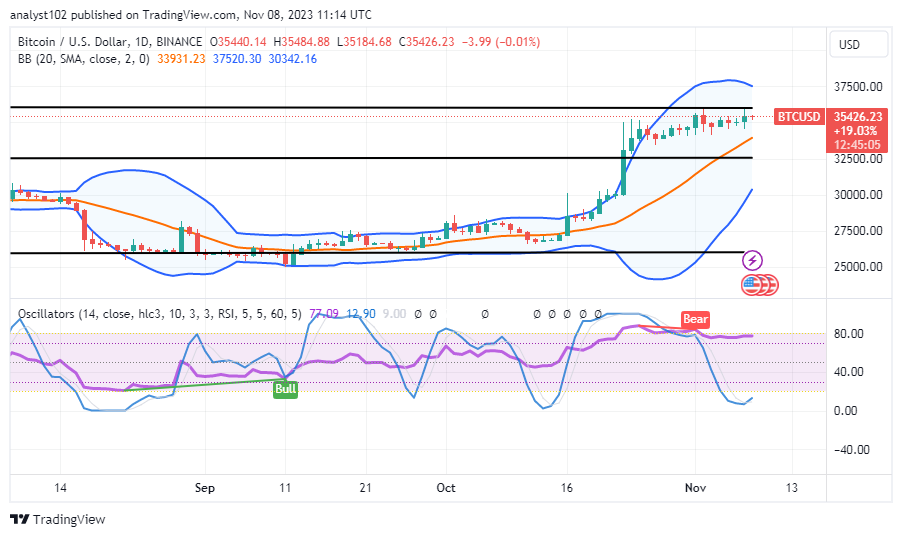
What direction does the next volatility index tend to follow from its current trading spot of $35,426.23?
The stochastic oscillators have indicated a sense of loss in seeing sellers push aggressively from higher points of $35,426.23, given the BTC/USD trade garners vigor, trading around the logical line of $35,000.
Value lines between the middle Bollinger Band trend line of $33,931.23 and $32,500 are tenable to serve as the spots where purchasers are evenly expected to regain stances if a declining force tends to surface afterward. Investors are on the verge of running into recoveries as the market prepares for bullish-trending cycles.
The candlestick indicator continues to show that sellers are well-positioned to thwart any more upward surges beyond the $37,500 psychological barrier. Placers of short positions between that value line and the higher Bollinger Band trend line must use a variant strategic trade method.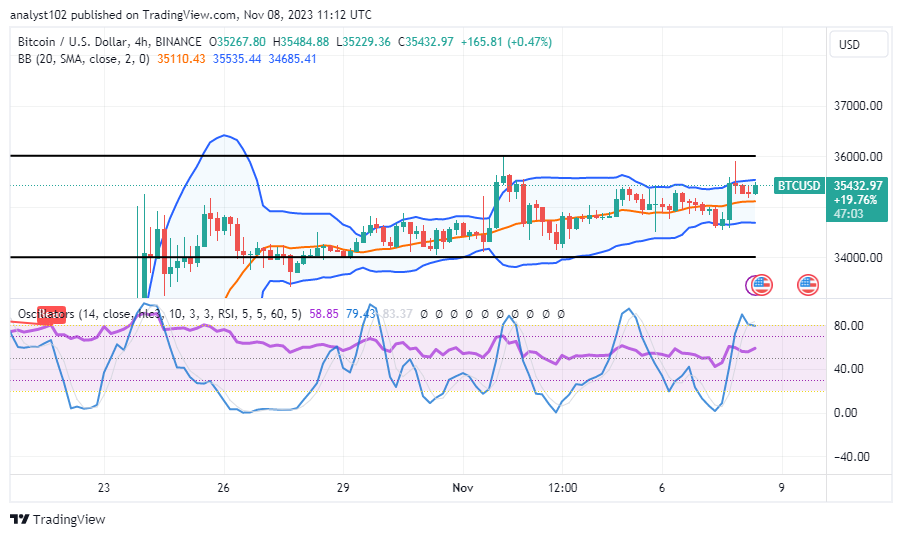
BTC/USD 4-hour Chart
The BTC/USD 4-hour chart showcases the crypto-economic trade garnering vigor around the point of $35,000, trading below the line of $36,000.
The Bollinger Band trend lines are located at $35,535.44, $35,110.43 for the middle line, and $34,685.41 for the bottom line. From 58.85 to 79.43, the stochastic oscillators have traveled in a northerly direction. When establishing a position near the upper Bollinger Band indication, long-position pushers should use caution.
Note: Cryptosignals.org is not a financial advisor. Do your research before investing your funds in any financial asset or presented product or event. We are not responsible for your investing results.
You can purchase Lucky Block here. Buy LBLOCK