Bitcoin (BTC/USD) Trade Extends Muscles, Hitting $35,000
Estimated Reading Time: 3 minutes
Don’t invest unless you’re prepared to lose all the money you invest. This is a high-risk investment and you are unlikely to be protected if something goes wrong. Take 2 minutes to learn more
Bitcoin Price Prediction – October 25
Loss of momentum by bears following their inability to have kicked against the logical line of $30,000 in the BTC/USD market leads the situation of the crypto-economic trade to extend muscles, hitting the resistance of $35,000.
The middle Bollinger Band’s stance is supporting the $30,000 underlying support line and illuminating the areas where the current intense uprising pressures are pressing. The price is currently trading at a positive amount of about $34,143.44 as of the writing of this technical article. A further scary climb to the north against the $35,000 resistance may extend to $40,000 in total.
BTC/USD Market
Key Levels:
Resistance levels: $35,000, $37,500, $40,000
Support levels: $30,000, $27,500, $25,000
BTC/USD – Daily Chart
The BTC/USD daily chart reveals that the crypto-economic trade extends muscles from $27,500, hitting the $35,000 resistance level.
The Bollinger Band trend lines are situated at $33,394.59, $28,923.96, and their lower part is at $24,453.32, respectively. The stochastic oscillators are positioned northward from 87.06 to 100, showcasing extreme overbought trading conditions that are ongoing. That calls for a need to exercise precautionary measures in the process of securing more fruitful increases in the valuation of the crypto economy.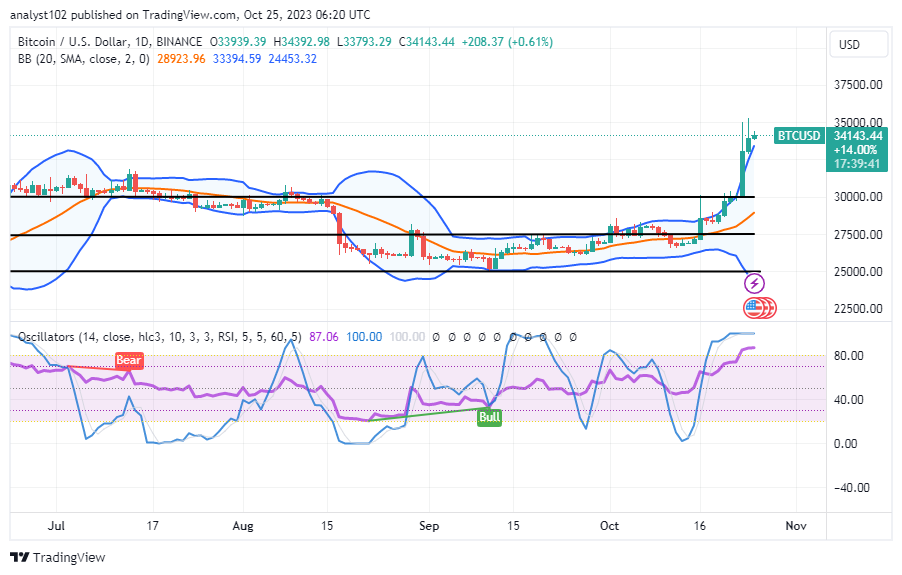
Is it theoretically safe for investors to continue breaking through the upper Bollinger Band indication at this point?
Capitalists who have been committing their funds into the base trading instrument should not pull out, as it is believed that more overhead barrier lines will be breached because the market has set into a stable bullish trend, given that the BTC/USD price extends muscles, hitting the $35,000 resistance level.
A logical closure would make timely rebound signals and value lines of $32,500 and $30,000, respectively. Bulls would need to strengthen their catalysts in order to effectively go above the current $35,000 resistance level.
Bears should be wary of making comebacks near the $35,000 resistance level because it has been over a few days. When a bearish candlestick is starting to form, 1-hour and 4-hour trade charts will support the probability of a timely, sensitive sell entry. To accomplish that, they had to take their time.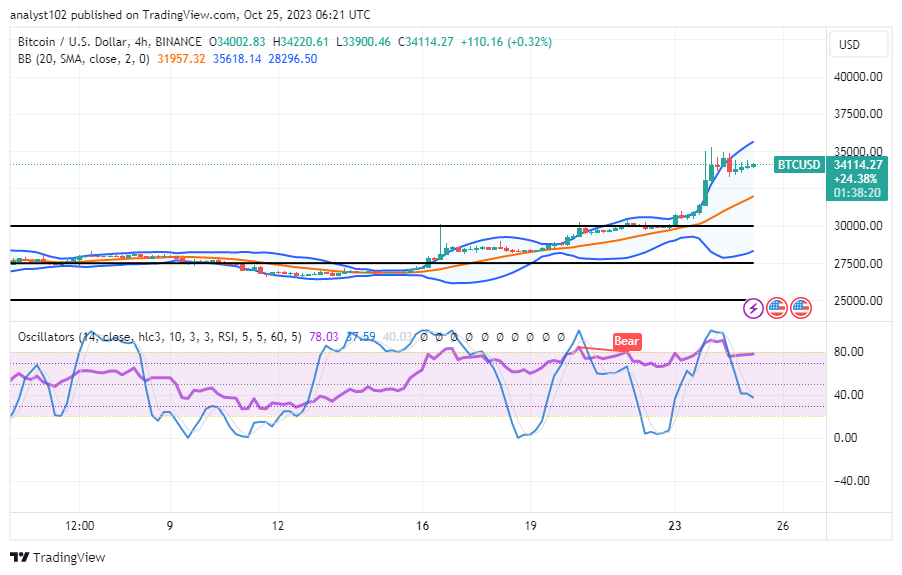
BTC/USD 4-hour Chart
The BTC/USD 4-hour chart reveals the crypto trade extends muscles, hitting the $35,000 barrier-trading spot.
The trend lines for the Bollinger Bands have been set at $35,618.14, $31,957.32, and $28,296.50. The southern stochastic oscillators are situated between 78.03 and 37.59 points. Around the top Bollinger Band’s trend line, a chain of candlesticks has developed to signify a state of transaction convergence. That suggests that a pit stop is still in progress. The important resistance level of $35,000 seems to be an area of uncertainty for a while.
Note: Cryptosignals.org is not a financial advisor. Do your research before investing your funds in any financial asset or presented product or event. We are not responsible for your investing results.
You can purchase Lucky Block here. Buy LBLOCK