$SPONGE (SPONGE/USD) Surges, Seeks Support at $0.00005
Estimated Reading Time: 3 minutes
Don’t invest unless you’re prepared to lose all the money you invest. This is a high-risk investment and you are unlikely to be protected if something goes wrong. Take 2 minutes to learn more

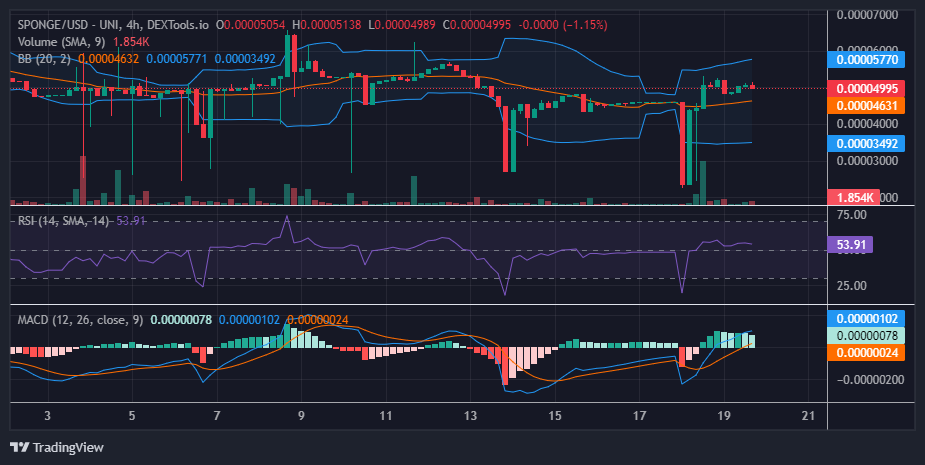
For a span of two days, the $SPONGE market remained stagnant at approximately $0.000044 as buyers and sellers found themselves in a deadlock. However, the market regained momentum when a sudden hyper-bearish move escalated market volatility since yesterday’s trading session. This, in turn, revived the bull market as traders began to buy the dip. This momentum continued into today as the market witnessed a notable shift in dynamics, marked by a substantial surge in price. This upturn followed the emergence of a Dragonfly Doji candlestick pattern around the $0.000044 price threshold, catalyzing a significant breakout. Consequently, bullish sentiment is poised to prevail, targeting the $0.00005 price milestone.
Key Market Dynamics:
- Resistance Levels: $0.0010, $0.0011, and $0.0012.
- Support Levels: $0.000035, $0.000030, and $0.000025.
Delving into Technical Analysis for $SPONGE (SPONGE/USD):
The Dragonfly Doji signals a noteworthy recovery in the bullish market following a sharp dip to the $0.000024 price level. However, market activity then stagnated around the $0.000044 mark before a breakout occurred. The strength of this breakout compelled bears to retreat to the $0.00005 price level. Despite their resurgence at this level, a near-support level has formed at $0.0000482, effectively halting further price declines.
Indicators suggest a marginal victory for the bulls, with the Relative Strength Index (RSI) indicating bullish momentum slightly above the 50 level. Additionally, the RSI line has consistently hovered around the 53 level for a few sessions. If this back-and-forth between bulls and bears persists, volatility may decrease, leading to Bollinger bands converging into narrower bands. Such a convergence could signal an imminent price breakout.
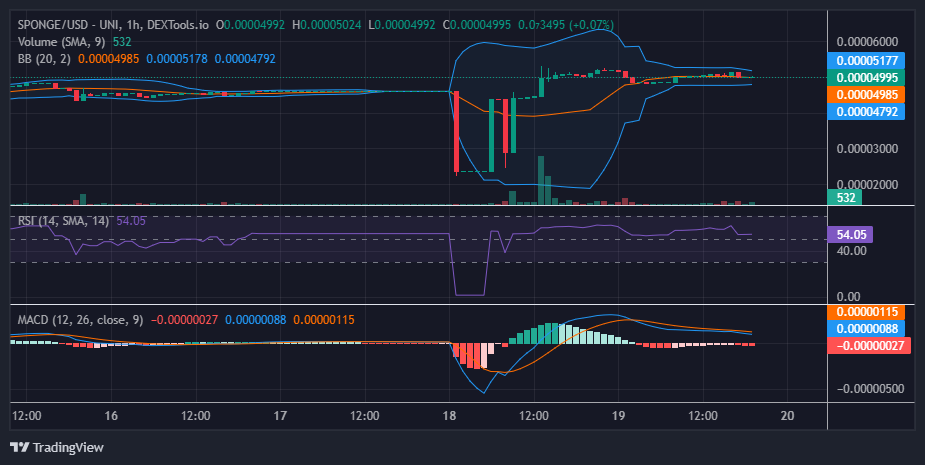
Insights from the 1-Hour Perspective:
From the perspective of the 1-hour chart, the price action is exhibiting sideways movement within a narrow range, slightly above the 20-day moving average. This consolidation phase suggests an impending climax in the ongoing tug-of-war between buyers and sellers, hinting at a potential breakout in the near future. Given this crypto signal, that is, the current position above the 20-day moving average, the breakout is anticipated to occur in the upside direction.
Buy the SPONGE/USD!
Exciting news! There are now over 9.8 Million $SPONGE tokens staked! 🔥🧽#SpongeV2 #Crypto #100x #Alts pic.twitter.com/WBt3fCvnZm
— $SPONGE (@spongeoneth) April 18, 2024
Invest in the hottest and best meme coin. Buy Sponge ($SPONGE) today!