Litecoin (LTC/USD) Beefs upon the Current Rallying Moves from the $220 Support Level
Estimated Reading Time: 3 minutes
Don’t invest unless you’re prepared to lose all the money you invest. This is a high-risk investment and you are unlikely to be protected if something goes wrong. Take 2 minutes to learn more
Litecoin Price Prediction – April 27
It has now come to establish that the valuation of LTC/USD has to rebound from a recent price correction from the depth of a lower support level of $200.
LTC/USD Market
Key Levels:
Resistance levels: $270, $290, $310
Support levels: $200, $180, $160
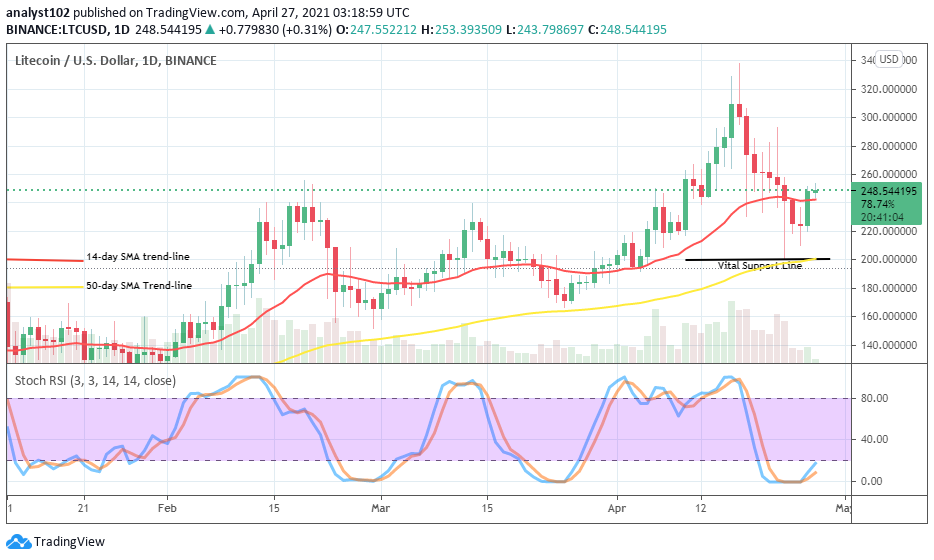
LTC/USD – Daily Chart
There has been a strong indication that the LTC/USD market worth has embarked on an increasing move after the emergence of a bullish trading candlestick. In the process of forming during yesterday’s session, the 14-day SMA trend-line was breached northwardly. And, the 50-day SMA indicator is at a vital support line of $200. The Stochastic Oscillators are dipped in the oversold region slightly crossing towards the north to signal a start of an upswing in the crypto’s price weight as paired with the fiat currency.
Will the LTC/USD continue to surge northward further from the current rallying?
The LTC/USD market line is now expected to push northward further with more ease by breaking through some resistant points as it has now set on for a bull’s ride. On a usual form, the crypto’s appreciation move will most likely experience witness difficult trading position to break past the key resistance level of $280 as it averages it.
On the downside, it is most probable that the LTC/USD present trading stance will likely push against most of attempts that bears will be making until the next few number of days’ sessions. A forceful downward reversal against the $240 may lead price to retest a lower support point between the levels of $220 and $200. And, such a sudden move will tend to live for a short-time. 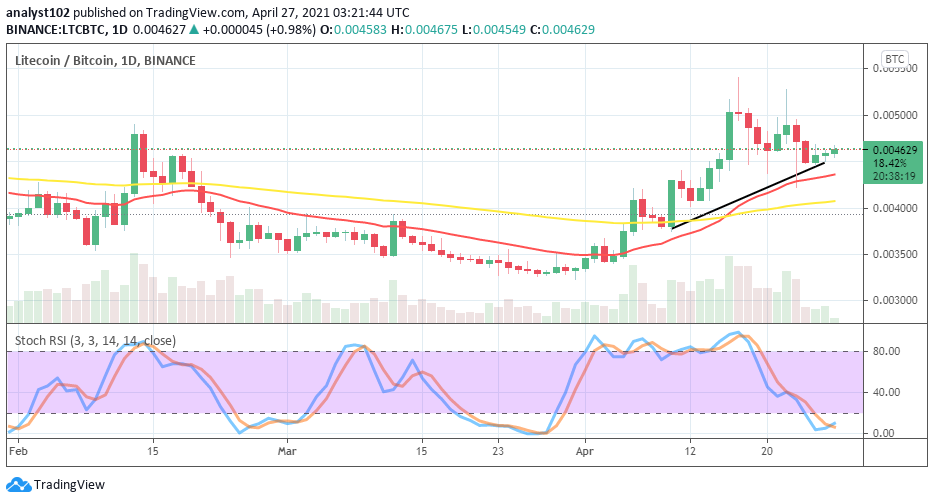
LTC/BTC Price Analysis
There have been some failing attempts made by BTC against LTC at a high trading zone in comparison on the chart. As a result, the crypto base’s purchasing power has forced to resort to seeing a line of what looks like a range-bound trading condition as paired with its counter instrument. The 50-day SMA indicator is underneath the 14-day SMA trend-line. The Stochastic Oscillators are slantingly down from the overbought region into the oversold region to now seemingly begin to cross to the north. That signifies that the base crypto’s energy is yet to lose momentum on the scale of comparison.
Note: cryptosignals.org is not a financial advisor. Do your research before investing your funds in any financial asset or presented product or event. We are not responsible for your investing results.