Ethereum (ETH/USD) Market Operation Is Hovering at $1,500
Estimated Reading Time: 3 minutes
Don’t invest unless you’re prepared to lose all the money you invest. This is a high-risk investment and you are unlikely to be protected if something goes wrong. Take 2 minutes to learn more

Free Crypto Signals Channel
Ethereum Price Prediction – July 25
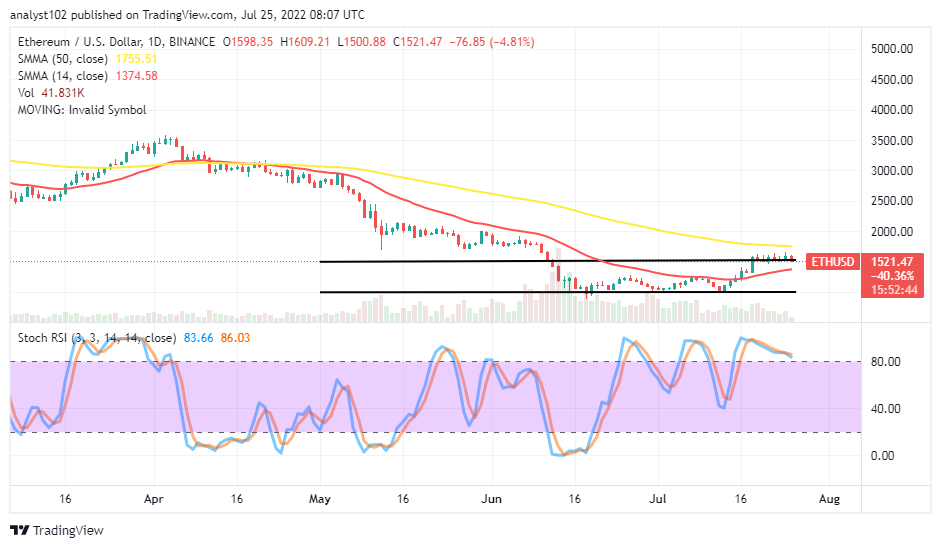
The present trading situation in the ETH/USD market operation showcases price is hovering at the $1,500 trading line over a couple of days’ sessions. In the last few hours, the crypto economy has had $1,609 and $1,500, trading around $1,521 at a negative of 4.81%.
ETH/USD Market
Key Levels:
Resistance levels: $1,750, $2,000, $2,250
Support levels: $1,250, $1,000, $750
ETH/USD – Daily Chart
The ETH/USD daily chart reveals the crypto-economic market operation is hovering at the $1,500 level. The upper horizontal line drew at the value line, and the lower horizontal line drew at the $1,000 support level to denote the area where the price still moves in ranges. The 14-day SMA indicator has slightly bent northward to the higher value line underneath the 50-day SMA indicator. The Stochastic Oscillators are in the overbought region, with their lines conjoined to indicate the market is in a state of indecision.
Is it technically inclined to launch a buying order in the ETH/USD market at $1,500?
It has been that the ETH/USD market operation is hovering at $1,500. And the launching of a buying order at the value line without a tangible price action, emanating to back up its continuation to the upside, may in no time suffer losses of momentum. As a result of that sentiment, it would be technically ideal for long-position placers to suspend their new entries around the value line. There can be a safe buying entry after the price has settled at a lower-trading zone to formulate a new outlook, suggesting a decent resumption of buying orders afterward.
On the downside of the technical analysis, the ETH/USD market bears may control the price from within the point of the 50-day SMA at $1,755 and the current upper range zone at $1,500. Confirmation needed to occur from an emergence of a bearish candlestick around the latter value line to portend an early featuring of a downward-trending motion. The overall verdict remains that buyers should be wary of the bulls trap should the market shoot up abruptly from around the upper range.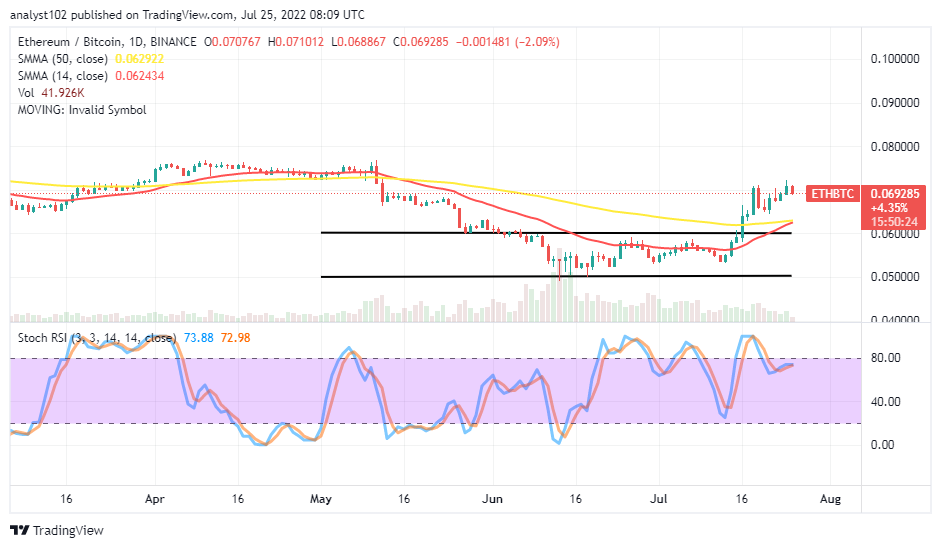
ETH/BTC Price Analysis
Ethereum has continually held firmly at a higher-trading resistance against Bitcoin over the trend lines of the SMAs. The cryptocurrency pair price is hovering at a higher-trading zone over the indicators. The 14-day SMA indicator has moved northward out of the range-bound zones, trying to touch the 50-day SMA indicator closely from beneath. The Stochastic Oscillators have crossed southbound from the overbought region to position below the 80 range. A bearish candlestick is in the making to give that the market is declining gradually.
Note: Cryptosignals.org is not a financial advisor. Do your research before investing your funds in any financial asset or presented product or event. We are not responsible for your investing results.
You can purchase Lucky Block here. Buy LBLOCK: