Bitcoin (BTC/USD) Trade to Touch $27,000, Aiming Spring Ups
Estimated Reading Time: 3 minutes
Don’t invest unless you’re prepared to lose all the money you invest. This is a high-risk investment and you are unlikely to be protected if something goes wrong. Take 2 minutes to learn more
Bitcoin Price Prediction – October 11
A notable loss of momentum has been recorded against bulls pushing northward away from a barrier trading axis of $28,000 in the recent sessions, making the BTC/USD trade touch a lower-trading support line of $27,000, aiming for spring ups.
A path indicating a bullish orientation has been illustratively constructed to mark up a point around the value of $27,000 as a line of lowering pressures, providing a firm hint toward gaining great inputs for lengthy position orders. The Bulls will have to settle on restoring their support basement around the line of $26,000 if the current forces of the correction have to run more vividly. Nevertheless, it is advisable that buyers place their entry positions between or near the values given earlier in this analytics paragraph.
BTC/USD Market
Key Levels:
Resistance levels: $29,000, $30,000, $31,000
Support levels: $26,000, $25,000, $24,000
BTC/USD – Daily Chart
The BTC/USD daily chart showcases that the crypto trade is tentatively getting set to touch the line of $27,000, aiming to spring up even in the falling process as it is obtainable at the moment.
As of the writing of this psychological piece, the stochastic oscillators have traversed southbound to places from 26.88 to 50.93 points. In the interim, horizontal lines are drawn at $28,000 and $25,000. The Bollinger Bands are situated at $28,409.28, $27,191.12, and $25,972.96, respectively. There has been an uptake stance to show that the pathway is positioning more bullishly than any other direction, as we write.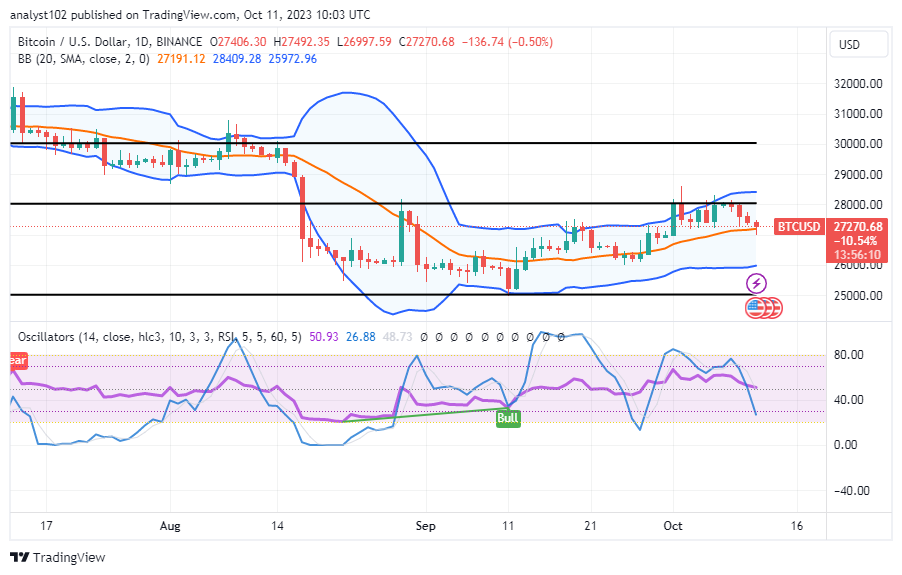
Which trade line, as the BTC/USD market runs a correction, is the crucial point against further lows?
The flashing trade axis is set around the spot of $27,000, and given that the BTC/USD trade touches the point, aiming springs up.
Given the current circumstances, buyers may begin to take positions around the middle Bollinger Band trend line. However, a craving for positions will develop if the price still needs to move further down after that point.
As of the compilation of this technical piece, bears should be cautious while pressing near the level of $27,000. Around that time, a fear factor will cause market activity to decline to a lower trading support of $26,000. Investors should feel free to buy back against the current southward trend if it surges back to the north.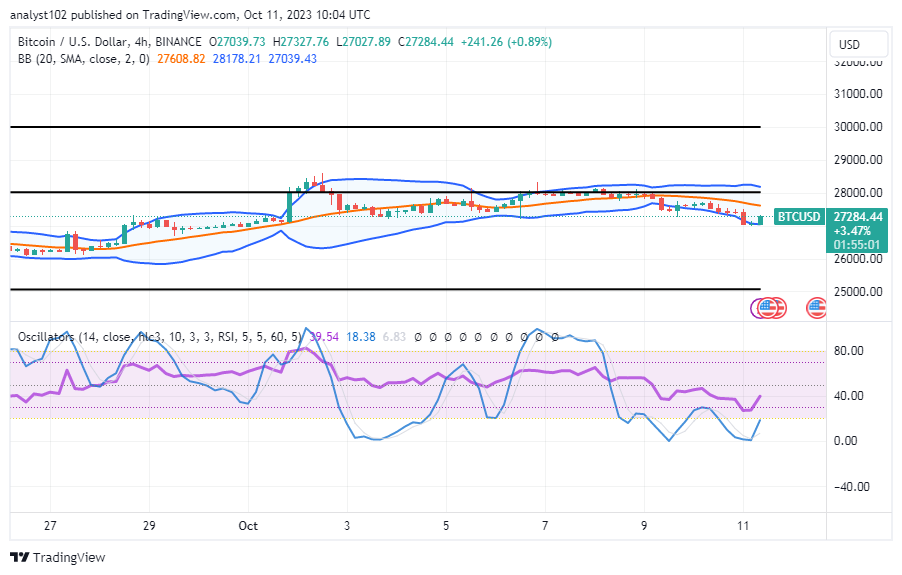
BTC/USD 4-hour Chart
The BTC/USD 4-hour chart showcases that the crypto-economic trade is getting ready to touch the point of $27,000, aiming for springups.
The stochastic oscillators are positioned southward from values of 39.54 to 18.38 to indicate that the base cryptocurrency market is about to regain its worth relative to the US dollar. At $28,178.21, $27.608.82, and $27.039.43, respectively, are the Bollinger Bands. The indicators’ upper portion shows an overhead barrier-trading line set up against the market’s current point. Bulls should be wary of any impending reversal motion against the base since a smaller bullish candlestick has emerged from the buy signal side of the lower band.
Note: Cryptosignals.org is not a financial advisor. Do your research before investing your funds in any financial asset or presented product or event. We are not responsible for your investing results.
You can purchase Lucky Block here. Buy LBLOCK