Bitcoin (BTC/USD) Price Is Slowing Down, Searching for Recoups
Estimated Reading Time: 3 minutes
Don’t invest unless you’re prepared to lose all the money you invest. This is a high-risk investment and you are unlikely to be protected if something goes wrong. Take 2 minutes to learn more

Bitcoin Price Prediction – September 27
A downward trending motion that occurred on September 11 has made a bottom at the $25,000 line, giving hope toward getting a resumption of the increase as the BTC/USD market operations are slowing down and searching for recoups.
Long-position placers should act when pullbacks appear below the moving averages so that the recouping process that is predicted by our technical tools will gain stances from the predicted rallying motion that will provide Buyers to continue staking positions in the interim, especially because the price has remained narrowly below its 14-day SMA as of the time of this technical article.
BTC/USD Market
Key Levels:
Resistance levels: $27,500, $28,500, $29,500
Support levels: $25,500, $24,500, $23,500
BTC/USD – Daily Chart
The BTC/USD daily chart reveals that the crypto-economic market is slowing down, searching for recoups from the sell signal sides of the moving averages.
The 14-day SMA indicator is trending at $26542.05 beneath the $27,432.64 value point of the 50-day SMA indicator. The stochastic oscillators have crossed southbound from the overbought region to keep stances from 25.77 to 8.56 points. Expectations on the possibility of the oscillators routing in a consolidation-moving manner will lead to low results on the south side.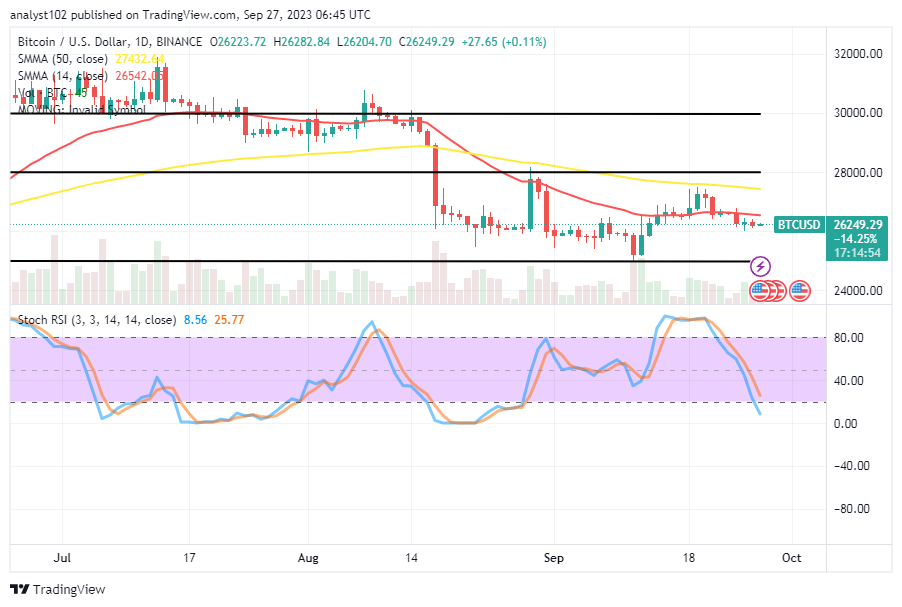
Should traders in the BTC/USD market operation fall even lower and stay below the SMAs for an extended period of time?
Partakers at different price levels in the trade activities between Bitcoin and the US Dollar have to be wary of going further below the trend lines of the moving averages, given that the crypto-economic price is slowing down and they are searching for recoups.
The stochastic oscillators’ current position still suggests that the sinking process can be continued below the level of $26,000 in order to recover an optimal purchase from the movements. A significant point is marked by the horizontal line established at $25,000, indicating that bears are not anticipated to go down freely in the long run.
Right now, it appears that sellers are progressively losing their presence just below the smaller moving average, which is a position that usually indicates that sellers are resorting to selling. Bears must consolidate, or the presumptive condition may pull up to meet resistance at the larger SMA’s point, in order for the subsequent selling force to be valid, providing a better opportunity for shorting.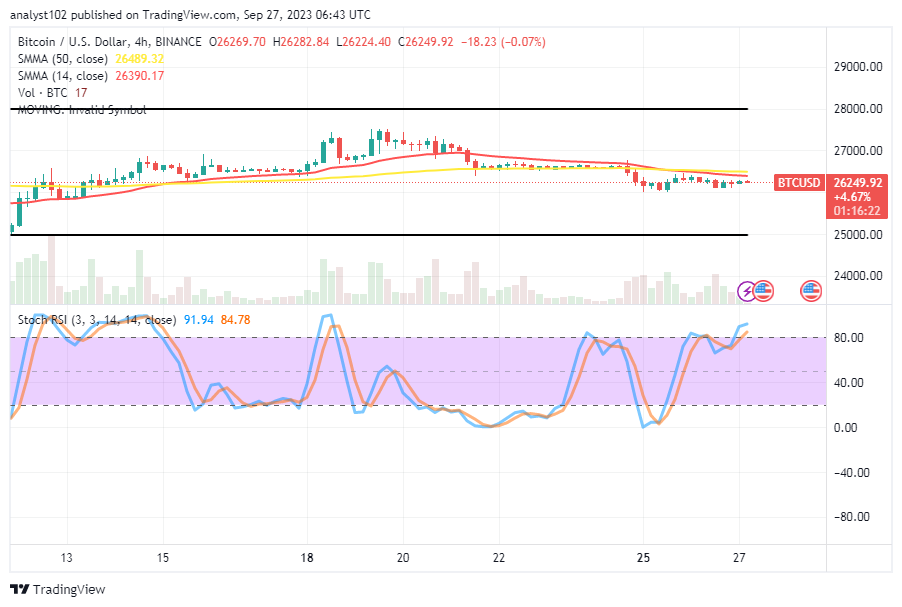
BTC/USD 4-hour Chart
The BTC/USD 4-hour chart showcases that the crypto price is slowing down between the points of the indicators and the line of $26,000.
The value of the 50-day SMA trend line is at $26,489.32 and is below the 14-day SMA trend line at $26,390.17. The stochastic oscillators are maintaining values between 84.78 and 91.94, indicating that they are overbought. An ideal indicator that is currently affirming this is that before regaining the necessary strength to push back upward, patience must be adhered to.
Note: Cryptosignals.org is not a financial advisor. Do your research before investing your funds in any financial asset or presented product or event. We are not responsible for your investing results.
You can purchase Lucky Block here. Buy LBLOCK