Bitcoin (BTC/USD) Trade Endeavors to Rise, Tending to Reverse
Estimated Reading Time: 3 minutes
Don’t invest unless you’re prepared to lose all the money you invest. This is a high-risk investment and you are unlikely to be protected if something goes wrong. Take 2 minutes to learn more
Bitcoin Price Prediction – September 20
Over a couple of sessions, even though it has been on a slow-and-steady track as bulls have been managing to outpace the market worth of the US dollar, given that the crypto trade endeavors to rise toward some resistances above $27,000, tending to reverse while volatility attempts to lose weights afterward.
However, there are still hopeful developments that investors should continue to buy into this cryptocurrency economy before the confirmation of the resumption of the bullish market cycle. A transaction condition has been set up against playing along with an upward move in the upcoming days.
BTC/USD Market
Key Levels:
Resistance levels: $28,000, $29,000, $30,000
Support levels: $25,500, $24,500, $23,500
BTC/USD – Daily Chart
The BTC/USD daily chart reveals that the crypto-economic trade endeavors to rise through some barriers, tending to reverse.
The 14-day SMA trend line is at $26,646.87 beneath the $27,588.98 value of the 50-day SMA trend line, which is at the top. The stochastic oscillators are in the overbought region, moving in a consolidation manner to position from 97.37 to 98.43 values, signifying that the momentum capacity to obtain in the pushes to the north side is vastly reducing.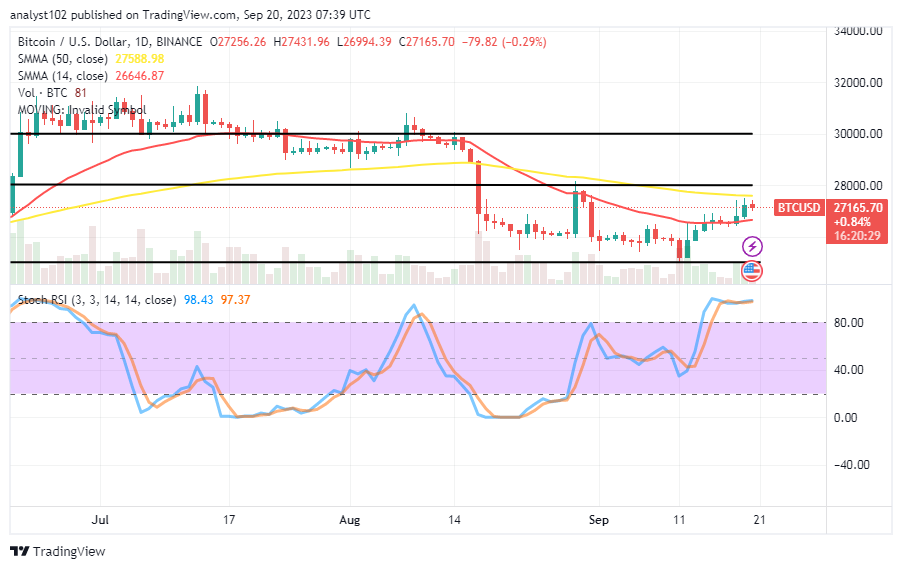
Should traders simply experiment with the dealing line without regard to price action, given the current state of the BTC/USD market?
A deep and critical look into the present operations in the BTC/USD market is suggesting that there should be active price action to back up any entry while placing a position as the crypto’s price endeavors to rise, tending to reverse based on the note that the stochastic oscillators pose at this moment.
Trading below the biggest resistance level, which is set at $30,000, suggests that entering the market now is practically ideal for positions to be left open for a lengthy period of time. Low-capital long-position traders may be more susceptible to losing out.
Bears may now begin to establish positions by capitalizing on any potential aggressive correction move that may occur after the price encounters resistance in the wake of a further ascent. Points near the smaller SMA’s trend line and the resistance line near $28,000 are crucial for obtaining a good shorting entry order in the interim.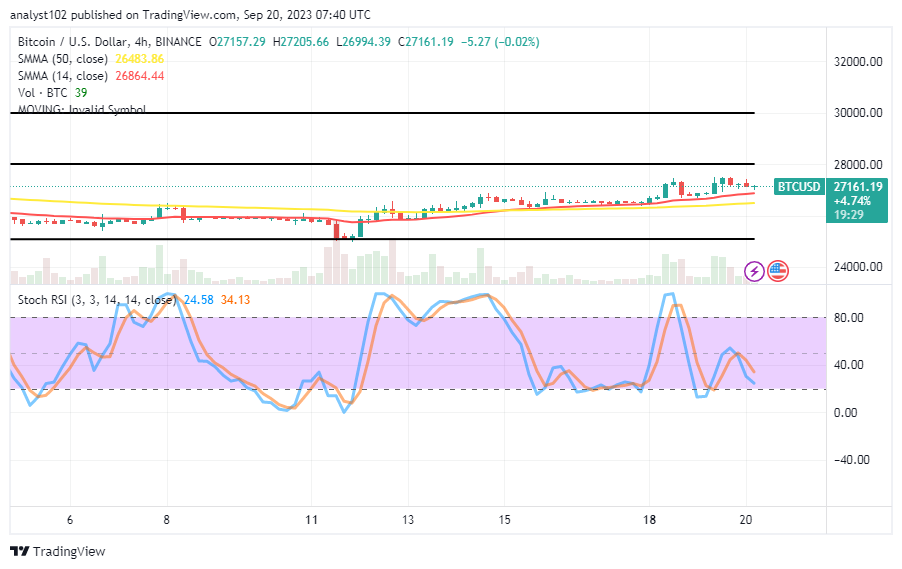
BTC/USD 4-hour Chart
The BTC/USD 4-hour chart reveals the crypto trade endeavor to rise, producing a bullish path on a slight mode, tending to reverse the move if unable to sustain it, and increasing the gravitation force through higher trade lines afterward.
Low levels of maintaining distances separate the 14-day SMA trend line from the 50-day SMA trend line. The stochastic oscillators are moving from 34.13 to 24.58 and are in a southbound-crossing state. A comprehensive mental trade theory predicts that if the threshold at $28,000 is broken, either a purchasing binge will continue or, if bulls fail to maintain the anticipated advances, a severe retracement process will occur.
Note: Cryptosignals.org is not a financial advisor. Do your research before investing your funds in any financial asset or presented product or event. We are not responsible for your investing results.
You can purchase Lucky Block here. Buy LBLOCK