The Bitcoin (BTC/USD) Price Finds a Seat, Striving for Increases
Estimated Reading Time: 3 minutes
Don’t invest unless you’re prepared to lose all the money you invest. This is a high-risk investment and you are unlikely to be protected if something goes wrong. Take 2 minutes to learn more
Bitcoin Price Prediction – September 13
A psychological resistance trade value line has been observed around $26,506.38 in the transaction activities between buyer and seller in the BTC/USD business operations, as it has been pinpointed that the crypto’s price has found a seat around the support area of $25,000 recently, striving for increases.
Now that it has been established, dropping fiat currency values applied to cryptocurrency transactions will often be temporary. Continuing with that premise, support points between $24,000 and $23,000 will eventually function as complementing underlying basic values to the line described in the last sentence of the previous sentence.
BTC/USD Market
Key Levels:
Resistance levels: $27,000, $28,000, $29,000
Support levels: $25,000, $24,000, $23,000
BTC/USD – Daily Chart
The BTC/USD daily chart reveals that the crypto-economic price finds a seat around the $25,000 support line, striving for increases beneath the trend lines of the moving averages.
The 14-day SMA indicator is below the value of $27,703.43 of the 50-day SMA indicator. The bigger moving average is positioned to evaluate the resistance area of $28,000. The stochastic oscillators keep a promissory index by staying around the point of 50, briefly pointing northbound from 43.13 to 55.48.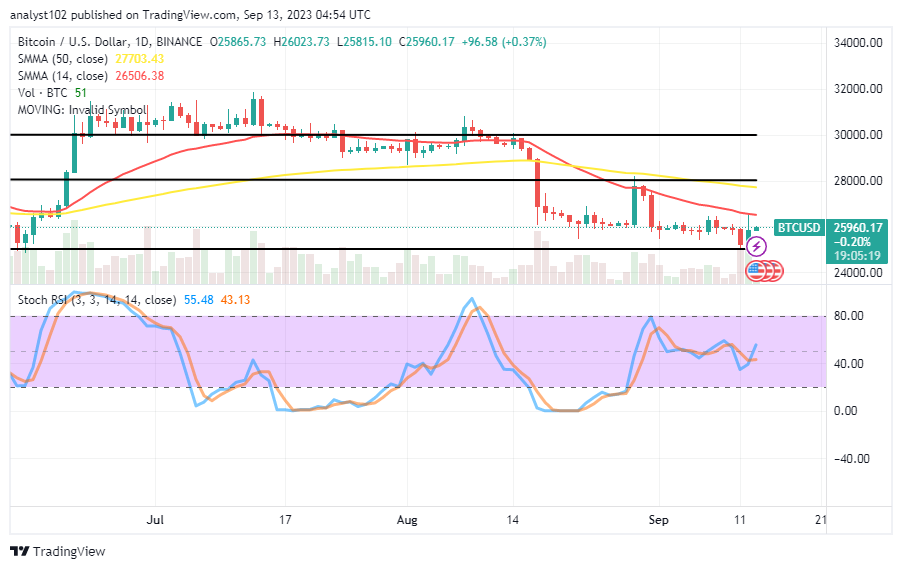
Will a reversal against the $25,000 market bottom for Bitcoin/USD lead to numerous drops over the long term?
A sudden reversal against the support level of $25,000 will pave the path for a window of opportunity to buy from another round of dips, given that the BTC/USD price finds a seat, striving for increases.
A rejection trading moment has occurred near the sell signal side of the 14-day SMA trend line, indicating that those traders who place long positions should be cautious about placing orders nearby for the foreseeable future. Long-term traders and investors, however, will succeed in the long run.
Regarding the technical analysis of the market’s depreciation process, holders of short positions would need to make an effort to prevent the trade from trembling in the face of some resistances, starting with the above-mentioned $28,000 milestone in the sessions. Sellers shouldn’t focus too much on any SMA shorting entrance, let alone their underside.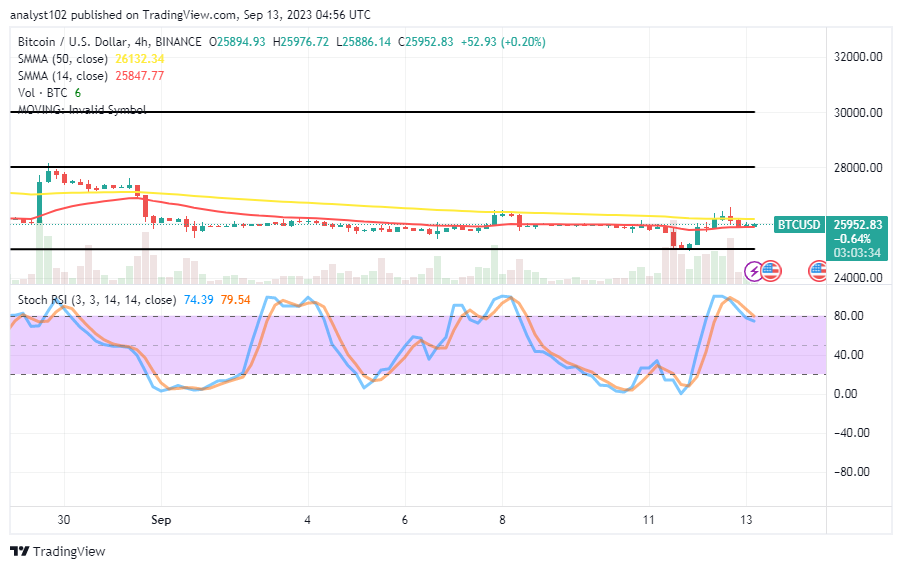
BTC/USD 4-hour Chart
The BTC/USD 4-hour chart shows the crypto trade finds a seat around the support level of $25,000, striving for increases around the spot of the overbought region as indicated by the oscillators.
The 50-day SMA indicator and the 14-day SMA indicator are closely trending. Their positional values are $25,847.77 and $26,132.34, respectively. The stochastic oscillators have briefly moved from 79.54 to 74.39 after briefly entering the overbought area, signaling a warning against the initiation of any position execution. In the meantime, a series of downward shifts may be developing toward a shift in the oscillators’ stance pattern, which would indicate a good moment to place a buy order later.
Note: Cryptosignals.org is not a financial advisor. Do your research before investing your funds in any financial asset or presented product or event. We are not responsible for your investing results.
You can purchase Lucky Block here. Buy LBLOCK