Bitcoin (BTC/USD) Trade Stages an Upswing, Following a Base
Estimated Reading Time: 4 minutes
Don’t invest unless you’re prepared to lose all the money you invest. This is a high-risk investment and you are unlikely to be protected if something goes wrong. Take 2 minutes to learn more
Bitcoin Price Prediction – August 30
An aftermath falling situation that lately produced lows breaking through some supports beneath the psychological support of $26,000 has exhausted its gravitational forces in the BTC/USD market operation, making the crypto trade stage an upswing, following the formation of a base around the value line.
During yesterday’s activities, there was a bouncing motion that created a strong bargaining path to the upside toward restoring some of the lost profitable upper lines. As of the time of writing, a retraction process seems to be making a corrective before maybe pushing back into the north side, provided that the move doesn’t ultimately get to the fundamentals.
BTC/USD Market
Key Levels:
Resistance levels: $29,000, $30,000, $31,000
Support levels: $26,000, $25,000, $24,000
BTC/USD – Daily Chart
The BTC/USD daily chart showcases the crypto-economic trade as it stages an upswing from the support level of $26,000, following the establishment of a base below the values of the moving average indicators.
The 14-day SMA trend line’s point of $27,672.93 is above the 50-day SMA trend line’s level of $28,300.16. The Stochastic Oscillators have moved from the oversold area to positions between 44.22 and 70.16 in a northerly direction. A smaller bearish candlestick is formed at the price’s touch with the smaller moving average to serve as a warning against placing a buy order for the time being.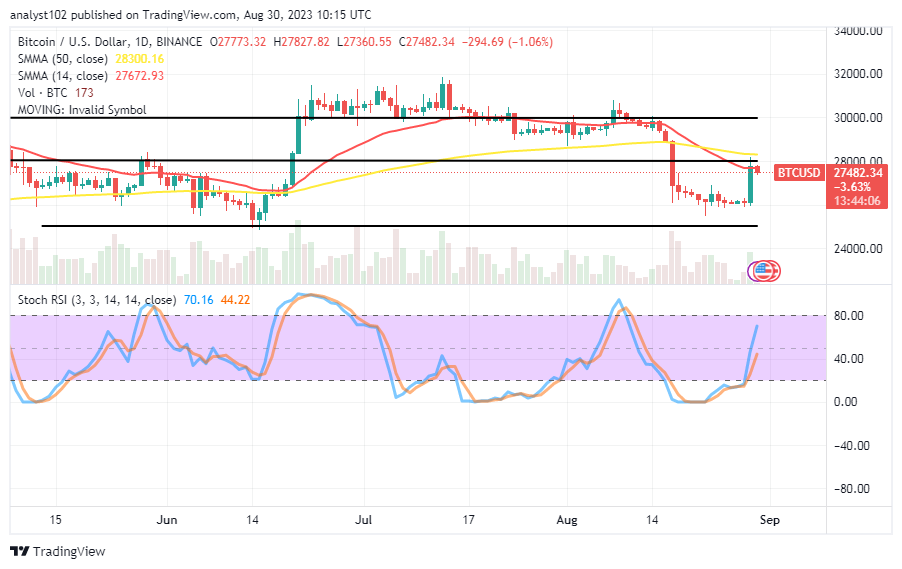
Should holders of long positions in the BTC/USD market long for a purchasing entry alongside yesterday’s bullish candlestick?
We are of the opinion that buyers need to be cautious in a situation where a retracement movement eventually leads to a bearish path back to the base of $26,000, given that the BTC/USD trade has staged an upswing after forming a foothold around the point recently.
Bulls may need to keep an eye out for when there will be a rallying motion against the negative push, as there has been a little correcting movement from the point of the 14-day moving average before going back to create a long position order. Investors shouldn’t start liquidating their investments before the designated time.
Bears in the BTC/USD market would need to intensify their presence during the current temporary decline that is surfacing near the lower SMA. Sellers will need to execute a stop-loss order slightly above the value of the larger SMA in order to checkmate their position in the market during the actual act of achieving just that.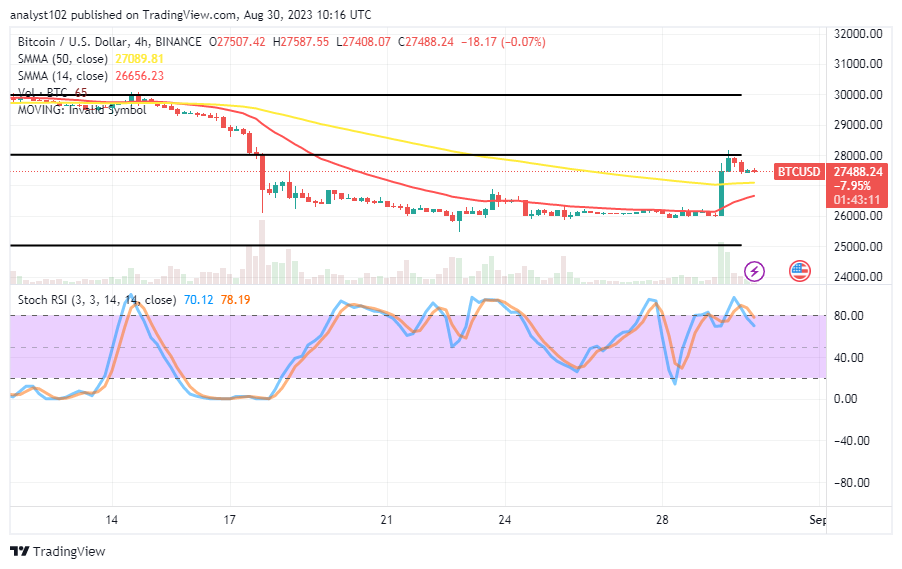
BTC/USD 4-hour Chart
The BTC/USD 4-hour chart showcases the crypto trade staging an upswing, following the creation of a base around the level of the $26,000 support.
The 14-day SMA indicator has momentarily curled southward, positioning itself at $26,656.23 under the 50-day SMA indicator’s $27,089.81. After entering the overbought area, the Stochastic Oscillators have moved southward from 78.19 to 70.12 levels. It is expected that traders who take long positions will restart their base-building strategy around the $27,000 mark in order to overcome the recent higher resistance level.
Note: Cryptosignals.org is not a financial advisor. Do your research before investing your funds in any financial asset or presented product or event. We are not responsible for your investing results.
You can purchase Lucky Block here. Buy LBLOCK