Bitcoin (BTC/USD) Market Continues, Featuring Closely Below $45,000
Estimated Reading Time: 3 minutes
Don’t invest unless you’re prepared to lose all the money you invest. This is a high-risk investment and you are unlikely to be protected if something goes wrong. Take 2 minutes to learn more
Bitcoin Price Prediction – January 16
The BCT/USD market continues, featuring closely below the $45,000 trading line since the last time the point breached southward. Presently, the crypto-economic price trades between the higher and lower value lines of $43,634 and $42,871 at a minute negative percentage rate of about 0.24 as of writing.
BTC/USD Market
Key Levels:
Resistance levels: $45,000, $47,500, $50,000
Support levels: $40,000, $37,500, $35,000
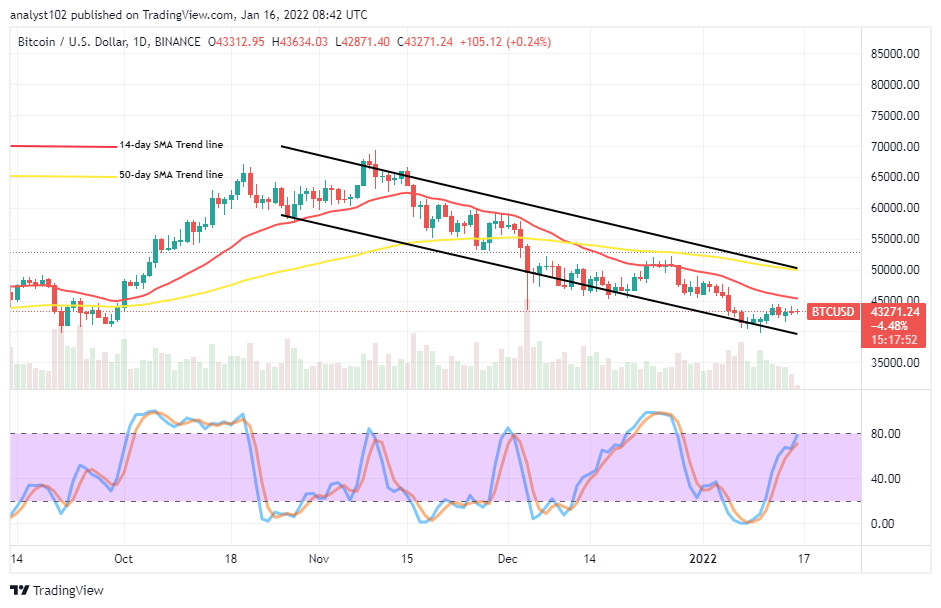
BTC/USD – Daily Chart
The BTC/USD daily chart showcases that the crypto-economic market continues, featuring closely below $45,000. Variant bearish candlesticks are under the sell signal side of the smaller SMA. The 50-day SMA indicator is above the 14-day SMA indicator. That indicates that the crypto economy is running under a falling force. The bearish channels embody the paths that price has to keep for the sustainability of the current downward trend. The Stochastic Oscillators are seemingly, almost exhausted springing northward as they approach the higher range at 80. That suggests that the market may soon lose the strength to push higher reliably in the subsequent sessions.
Will the BTC/USD market operations push past the $45,000 as the crypto-economic market continues, featuring closely below the value line?
It still appears that the BTC/USD trade lacks the strength to keep afloat above the $45,000 even if breached northward as the crypto-economic market continues, featuring closely below the point. Meanwhile, some upward momentums are somewhat still in place on a lighter note beneath the value line. As a result, it would be psychologically ideal that traders stay alert to observe when an active falling force re-surfaces around the value line mentioned earlier before launching a sell order.
On the upside of the technical analysis, the aggressive force has to feature, breaking out at the $45,000 level to suggest getting more ups above the value line in the following operations. However, the presumed sudden hike may tend to test resistance around $50,000. On the contrary, long-position takers may stay off placing an order for now until the market moves lower down to a support trading zone between $40,000 and $37,500 to see if there will be around before launching a buying position.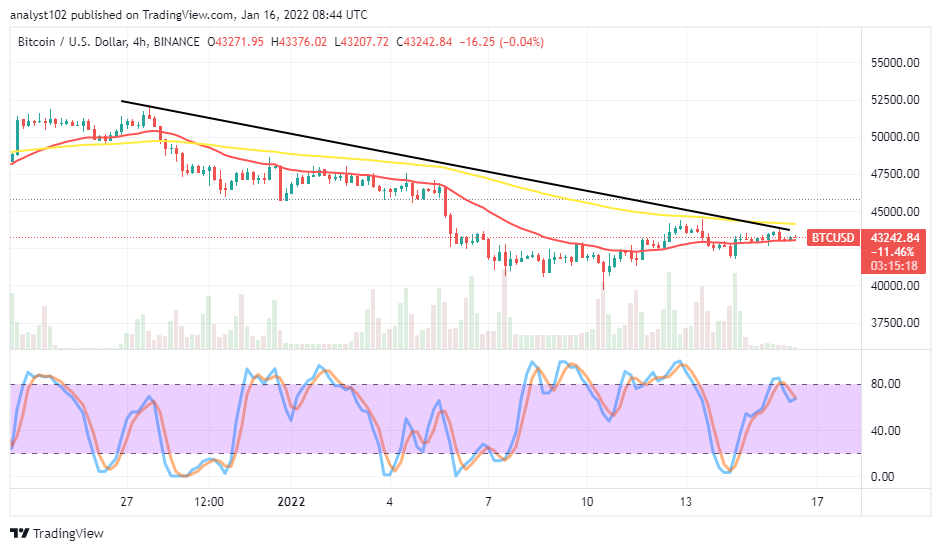
BTC/USD 4-hour Chart
The BTC/USD medium-term chart reveals that the crypto market continues, featuring closely below $45,000 beneath the trend line of bigger SMA. The 50-day SMA indicator is above the 14-day SMA indicator. The bearish trend line drawn is alongside the bigger indicator. The Stochastic Oscillators have moved into the overbought region. And they briefly crossed their lines southbound against the range of 80. The price is presently finding it hard to break through some resistances around the value line mentioned. Going by those sentiments, the crypto valuation may soon start to downsize while the US Dollar intensifies its stances in business activities.
Note: Cryptosignals.org is not a financial advisor. Do your research before investing your funds in any financial asset or presented product or event. We are not responsible for your investing results.
You can purchase crypto coins here. Buy Tokens