Near Protocol (NEAR/USD) Market Indicators Hints Strong Downward Trend Continuation
Estimated Reading Time: 3 minutes
Don’t invest unless you’re prepared to lose all the money you invest. This is a high-risk investment and you are unlikely to be protected if something goes wrong. Take 2 minutes to learn more

Near Protocol Price Forecast – October 11
NEARUSD market indicators hint at strong downward trend continuation. As the price hit the 78.6% retracement level, a notable crash ensued, indicating the strong presence of the bears in the market.
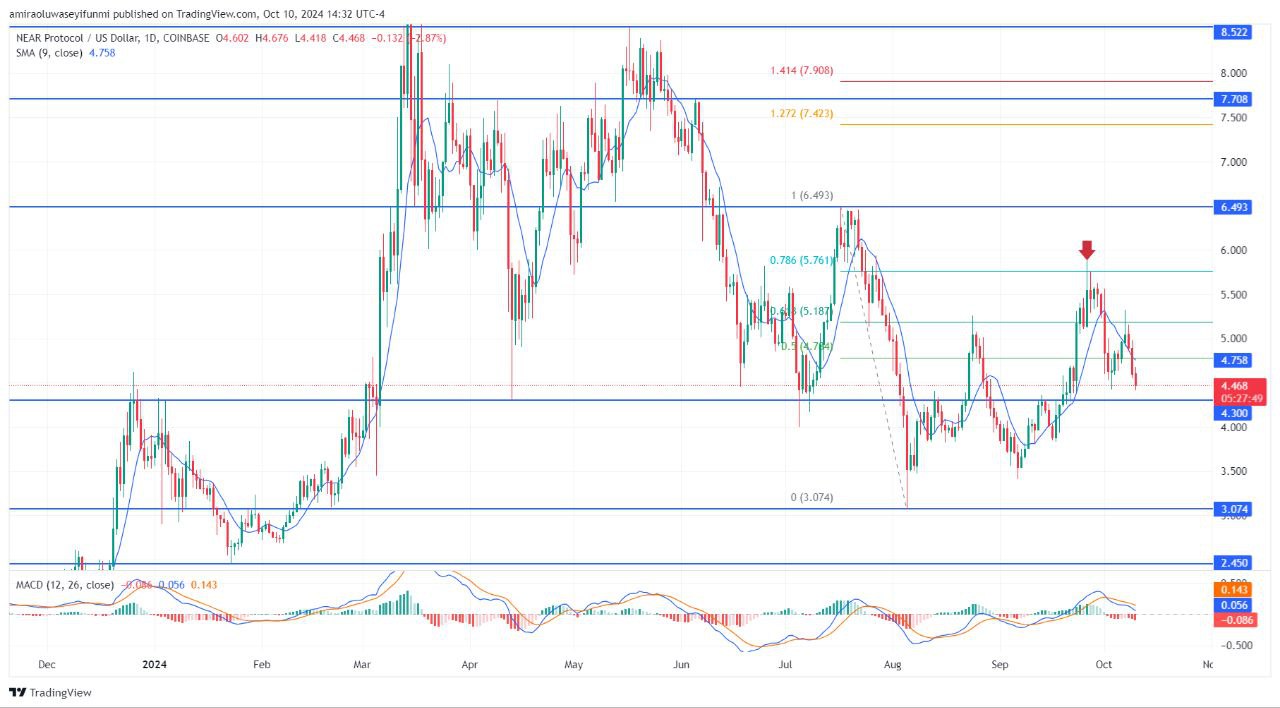
With the MACD value at -0.087, indicating a bearish crossover, the MACD (Moving Average Convergence Divergence) indicator for NEARUSD displays the MACD line crossing below the signal line. Furthermore, as long as the price stays below the 9-day SMA at $4.7570, it is functioning as dynamic resistance. Additionally, the histogram is moving downward, supporting the growing bearish momentum.
NEAR/USD Market Key Levels:
Resistance levels: $6.4930, $7.7080, $8.5220
Support levels: $4.3000, $3.0740, $2.4500
NEAR/USD – Daily Chart
The daily chart for NEARUSD shows the market is now in a bearish trend following the notable rejection from the premium zone.
In terms of price action, NEARUSD has broken below the $4.7570 dynamic resistance. The rejection from the 78.6% retracement level signals a reversal in the previous uptrend. A minor support area exists around $4.3000, but price weakness suggests further downside potential, especially with the failure to maintain the 0.786 Fibonacci level at $5.7610.
What is the short-term outlook of NEARUSD?
In the future, NEARUSD might retest the $4.3000 mark; a persistent decline below this would allow for additional losses towards $3.0740. If the bearish trend persists, lower levels such as $2.4500 may also be relevant. Short-term expectations are still negative unless the price can reclaim the recent high around $5.7610.
NEAR/BTC Price Analysis
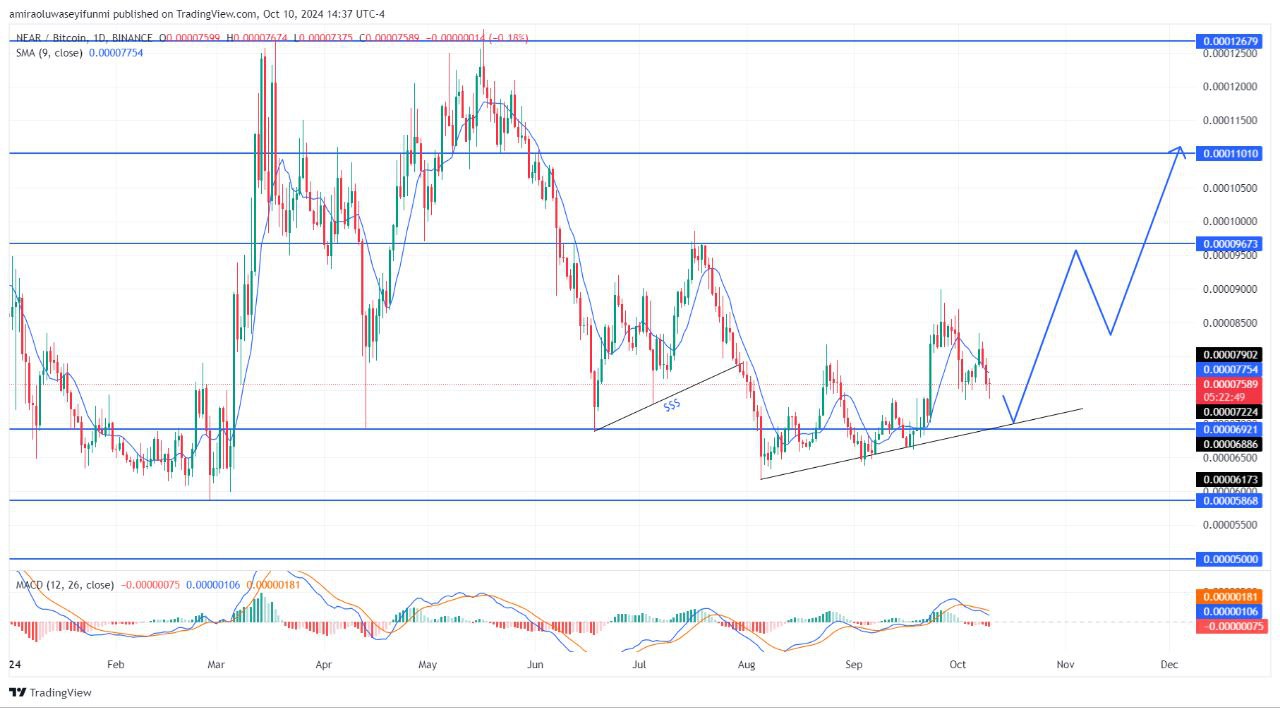
Since mid-August, the NEAR/BTC pair has been in a bullish trend, with higher lows forming on the ascending trendline. With a possible bounce towards the next resistance level at 0.00009670 BTC, price action is currently testing support at 0.00007220 BTC.
There appears to be less bearish momentum on the MACD histogram, suggesting that an upward move may be supported. The next target, around 0.00011010 BTC, would be reached if price breaks 0.00009670 BTC, indicating that the bullish momentum is still in place.
Near Protocol (NEAR) Current Statistics
Current price: $4.4620
Market Capitalization: $6,250,000,000
Trading Volume: $419,850,000
Place winning NEAR/USD trades with us. Get NEAR here