Dogecoin (DOGE/USD) Sets Sights on Breaking $0.12 Barrier
Estimated Reading Time: 2 minutes
Don’t invest unless you’re prepared to lose all the money you invest. This is a high-risk investment and you are unlikely to be protected if something goes wrong. Take 2 minutes to learn more
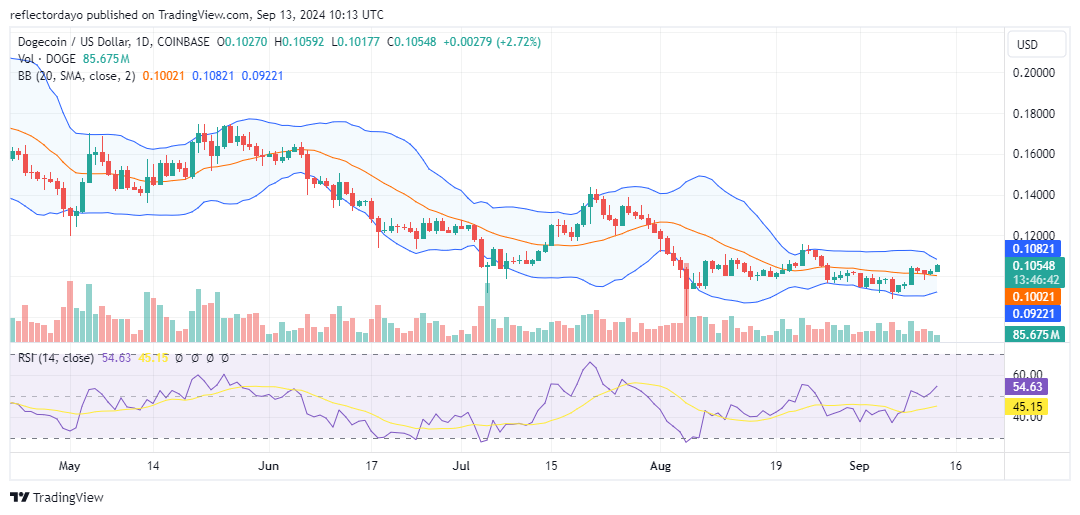
Since early August, the Dogecoin market has remained relatively stable around the $0.10 mark. Price action has been moving horizontally, fluctuating within a range of $0.093 to $0.110. However, since the beginning of September, the price dipped below $0.10, until recently when it regained upward momentum, reclaiming the $0.10 level. It now appears that the Dogecoin market has established support above $0.10, signaling a strengthening bullish trend.
Dogecoin Market Data
- DOGE/USD Price Now: $0.1053
- DOGE/USD Market Cap: $ 15.4 billion
- DOGE/USD Circulating Supply: 145.9 billion
- DOGE/USD Total Supply: 146.9 billion
- DOGE/USD CoinMarketCap Ranking: #8
Key Levels
- Resistance: $0.11, $0.12, and $0.13
- Support: $0.090, $0.085, and $0.008.
The Dogecoin Market Through the Lens of Indicators
While the Bollinger Bands continue to reflect a consolidating trend around the $0.10 price level, the Relative Strength Index (RSI) shows gains driven by bullish activity, with the RSI line rising above the 50 mark. The Bollinger Bands align with the bullish momentum observed in the RSI, as the price moves above $0.10 and the upper deviation narrows, signaling a sharp decline in market volatility. With supply and demand balancing out, this dynamic often precedes significant price movement. Given the bullish trend, the next major price move is likely to be upward, potentially targeting $0.12.
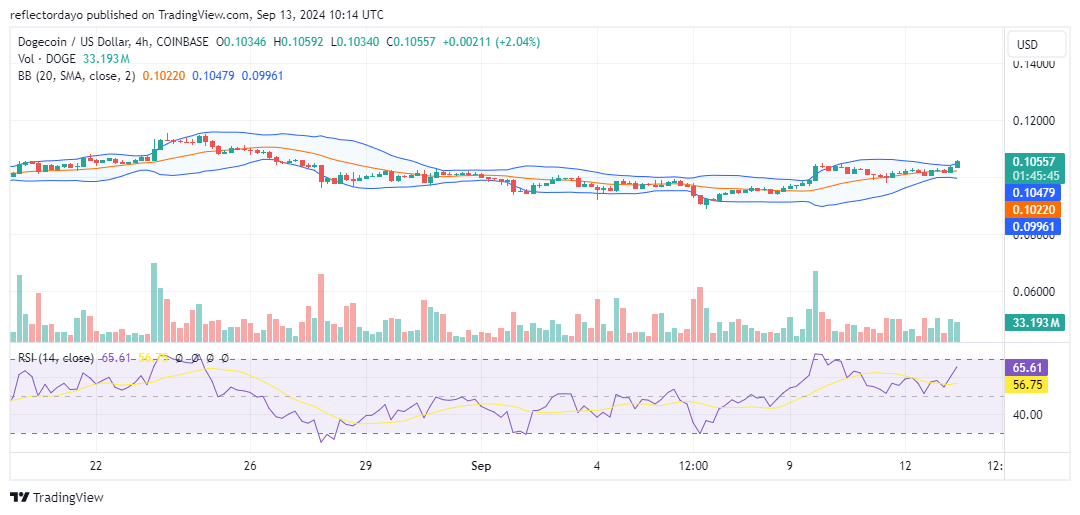
DOGE/USD Price Prediction: 4-Hour Chart Analysis
The market appears more bullish on shorter timeframes compared to the daily chart. In the Relative Strength Index (RSI), bullish momentum is gaining traction, with the RSI nearing the 70 level, which marks the threshold of the overbought region. Similar to the daily chart, demand and supply forces are balanced, but in recent trading sessions, the bulls have gained a slight advantage. This crypto signal is beginning to influence the Bollinger Bands, which are showing slight divergence as optimistic traders push the market higher.