Helium (HNT/USD) Pushes Toward a Breakout Above $2.77
Estimated Reading Time: 3 minutes
Don’t invest unless you’re prepared to lose all the money you invest. This is a high-risk investment and you are unlikely to be protected if something goes wrong. Take 2 minutes to learn more

Although the Helium market currently appears to be in a consolidation phase, bullish activity remains evident within this stable price range. Buyers are gradually building momentum, targeting a potential breakout above the key $2.77 resistance level.
A higher support base has formed around the $2.46 region, which aligns closely with the 20-day moving average. If this support level continues to hold, the likelihood of a breakout above $2.77 becomes increasingly plausible, potentially paving the way for further bullish expansion.
Helium (HNTUSD) Market Data
- HNT/USD Price Now: $2.74
- HNT/USD Market Cap: $511 million
- HNT/USD Circulating Supply: 186 million HNT
- HNT/USD Total Supply: 186 million HNT
- HNT/USD CoinMarketCap Ranking: #124
Key Levels to Watch
- Resistance: $3.00, $3.50, $4.00
- Support: $2.40, $2.00, $1.50
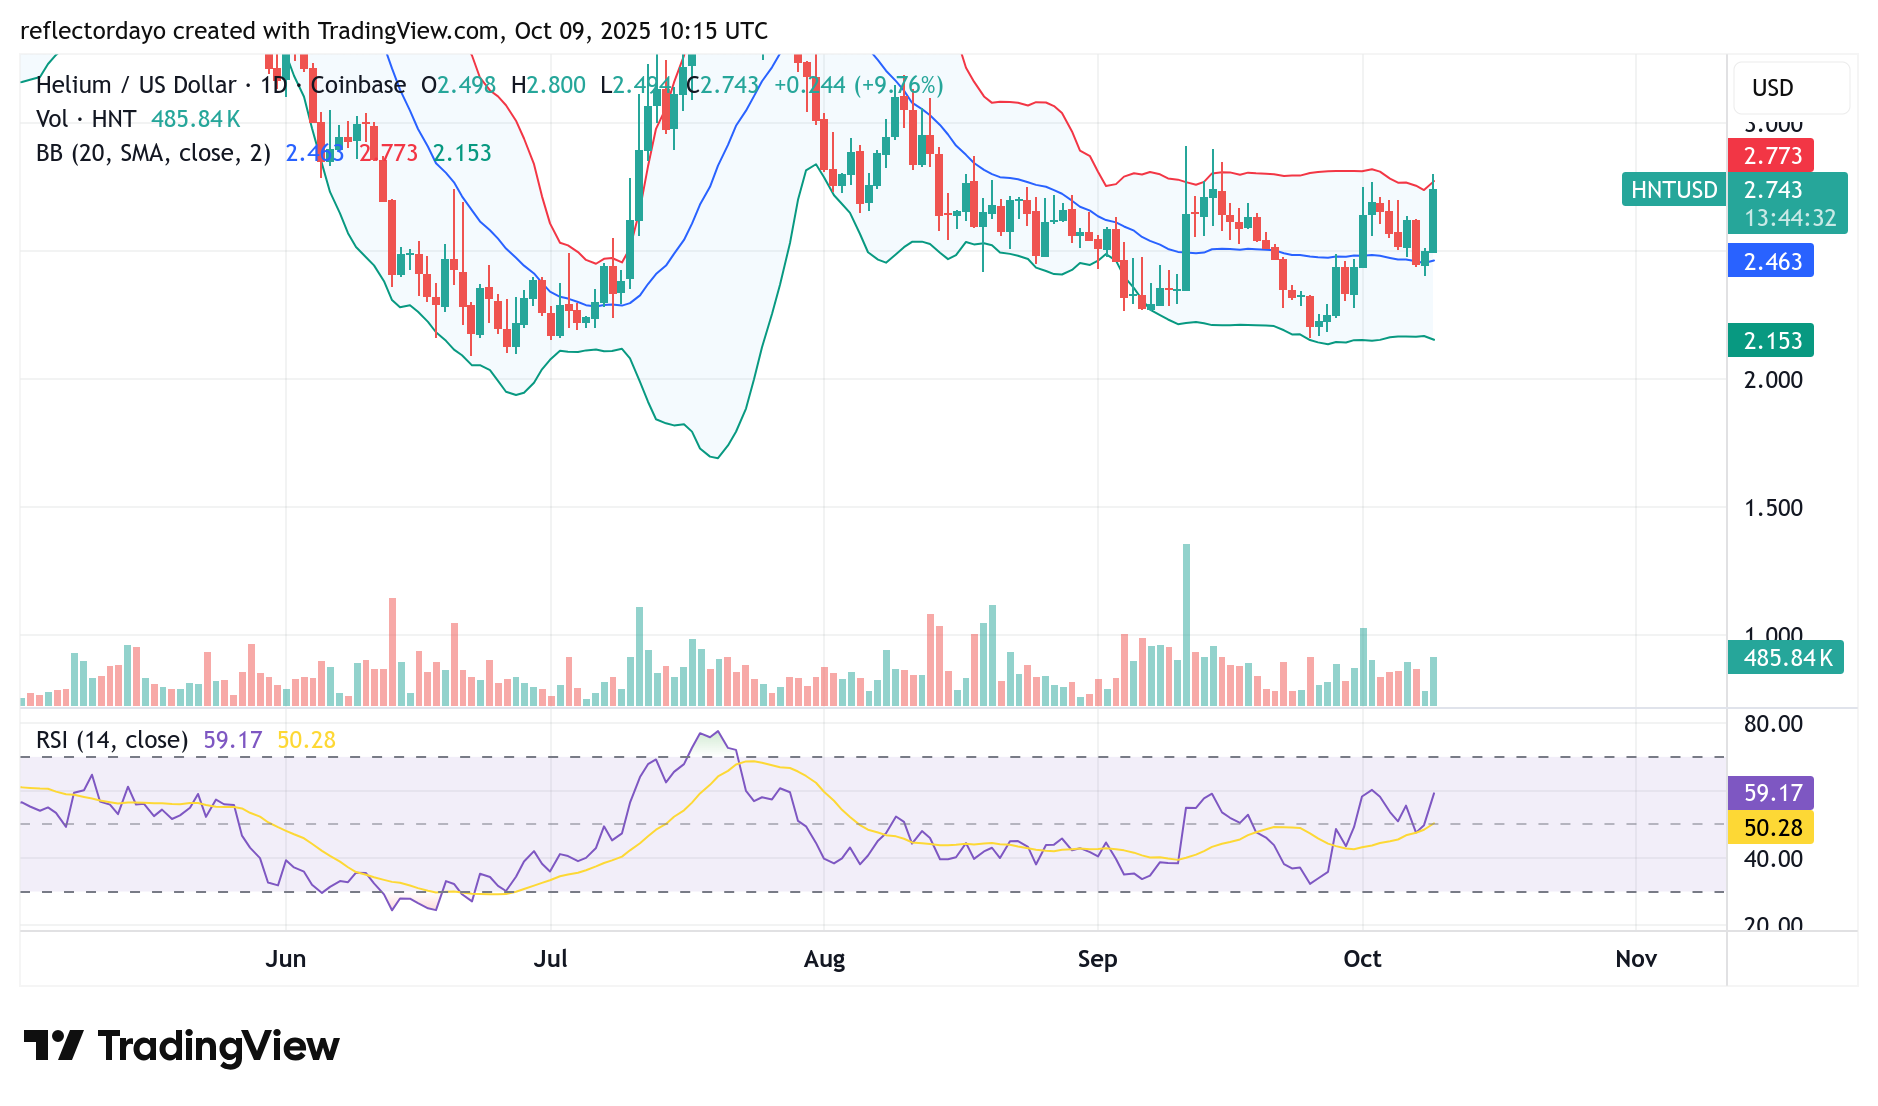
Helium (HNT/USD) Daily Chart Outlook
The Helium market reached a peak above the $4.00 level in early August before entering a bearish phase, largely triggered by profit-taking from traders at those highs. The subsequent decline extended until fresh bullish interest began to emerge between the $2.00 and $2.45 price zones.
Current market behavior suggests that bullish sentiment may be gradually strengthening around these levels, as the previous rally also originated near the $2.10 region. Over the past few trading sessions, a new higher support has formed around the $2.46 level—coinciding with the 20-day moving average—signaling an improvement in market confidence.
During today’s trading session, the market peaked near $2.80 before experiencing a minor pullback. However, bullish momentum appears to be defending the price around the $2.74 zone, reinforcing the possibility of a continued upward move in the near term.
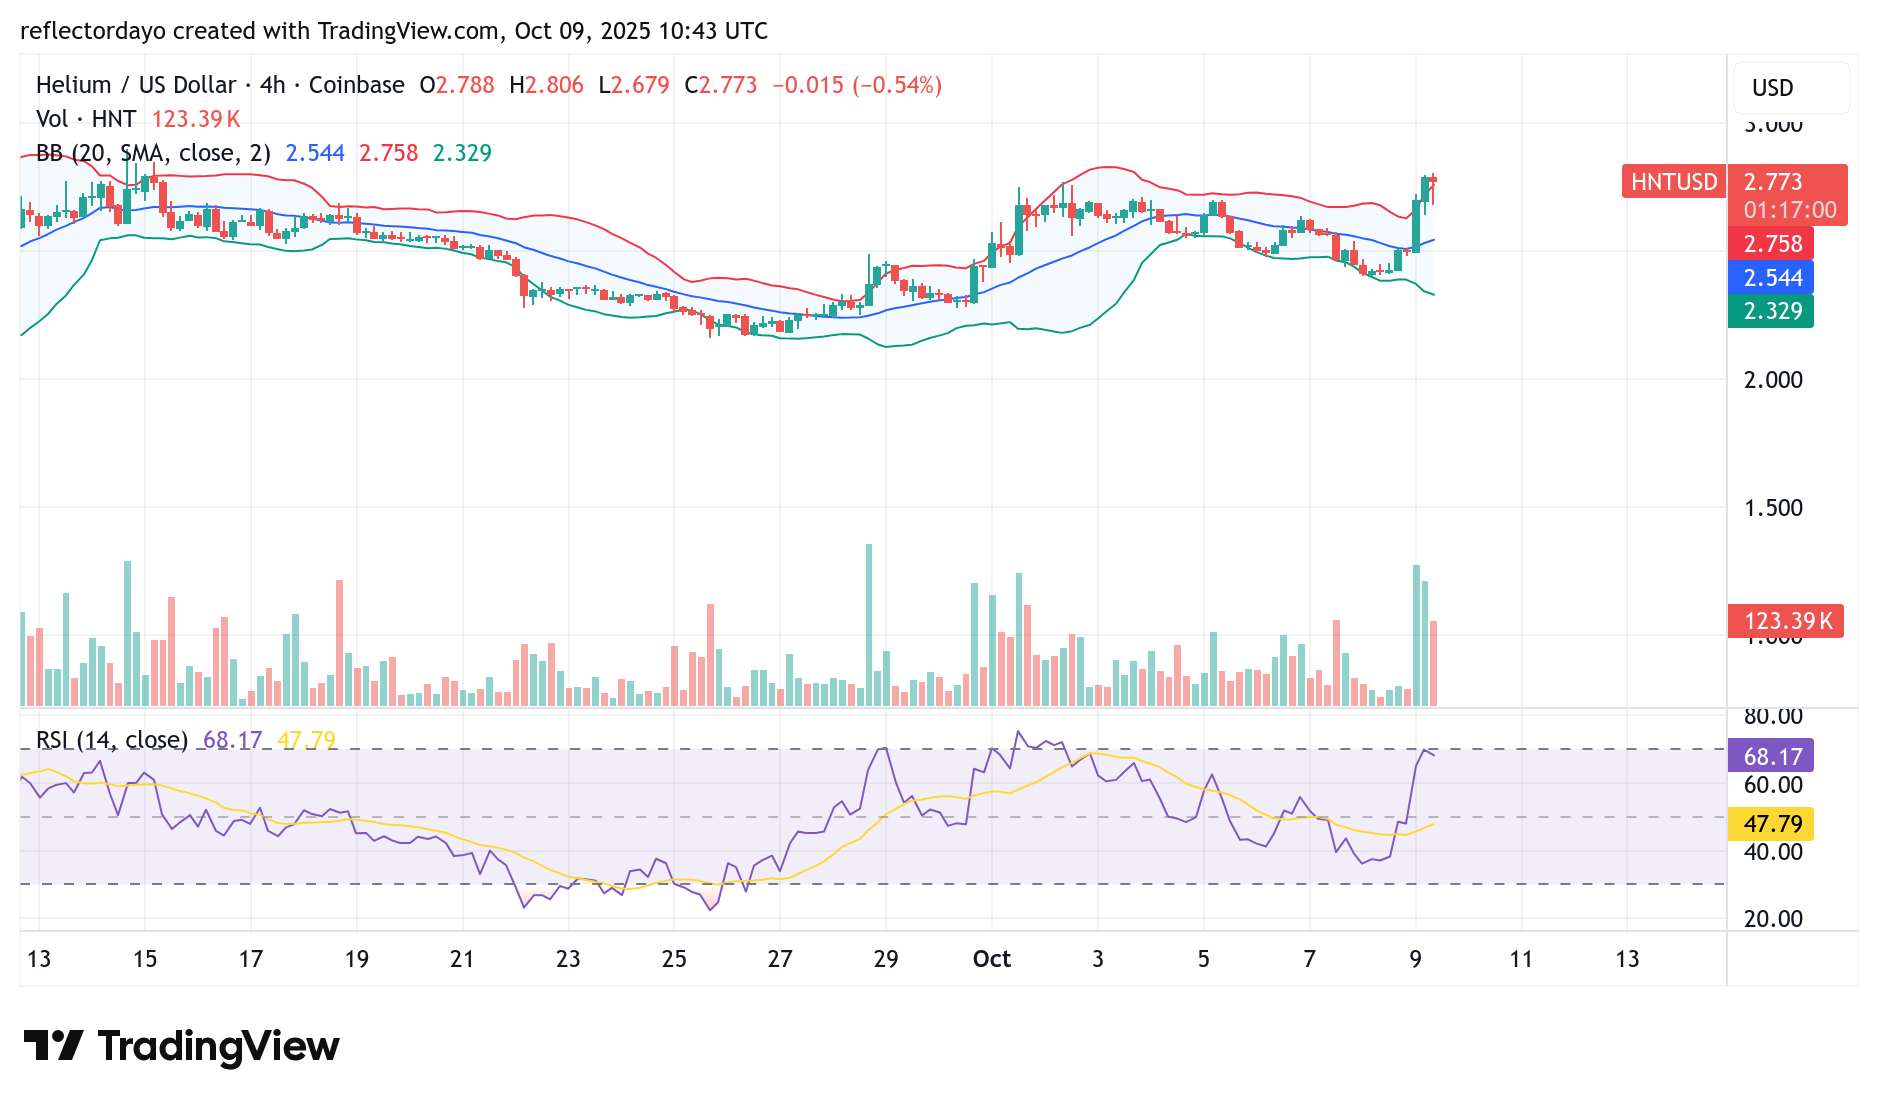
HNT/USD 4-Hour Chart Outlook
On the 4-hour chart, indicators reflect a strong bullish bias in the Helium market. After peaking around the $2.80 level earlier today, buyers appeared to re-enter near the $2.70 zone, suggesting the potential formation of a new higher support level. The repeated rejection of bearish attempts around this area over the past two sessions further reinforces bullish control.
However, according to technical indicators, the market is now approaching a point where a short-term correction could occur. A faceoff between bullish and bearish forces appears to be taking shape, and this growing indecision has led to a noticeable decline in trading volume. This setup often precedes a period of consolidation around the current price level, which could eventually build momentum for the next significant breakout.