Berachain (BERA/USD) Approaches Crossroads, But Bulls Maintain Momentum
Estimated Reading Time: 3 minutes
Don’t invest unless you’re prepared to lose all the money you invest. This is a high-risk investment and you are unlikely to be protected if something goes wrong. Take 2 minutes to learn more

The Berachain market has remained strongly bullish, with prices consistently trending upward since finding support at the $1.652 level. Since then, the market has continued to establish higher lows—first at $1.70, then at $2.24, and most recently at $2.58, where renewed buying pressure emerged earlier this morning.
Despite the sustained bullish trajectory, the current upward momentum faces a critical test at the $3.00 resistance level, which may pose a temporary challenge for bullish traders as the market approaches this key juncture.
Berachain (BERAUSD) Market Data
- BERA/USD Price Now: $2.74
- BERA/USD Market Cap: $353.3 million
- BERA/USD Circulating Supply: 128.3 million BERA
- BERA/USD Total Supply:
- BERA/USD CoinMarketCap Ranking: #159
Key Levels to Watch
- Resistance: $3.00, $3.50, $4.00
- Support: $2.50, $2.00, $1.50
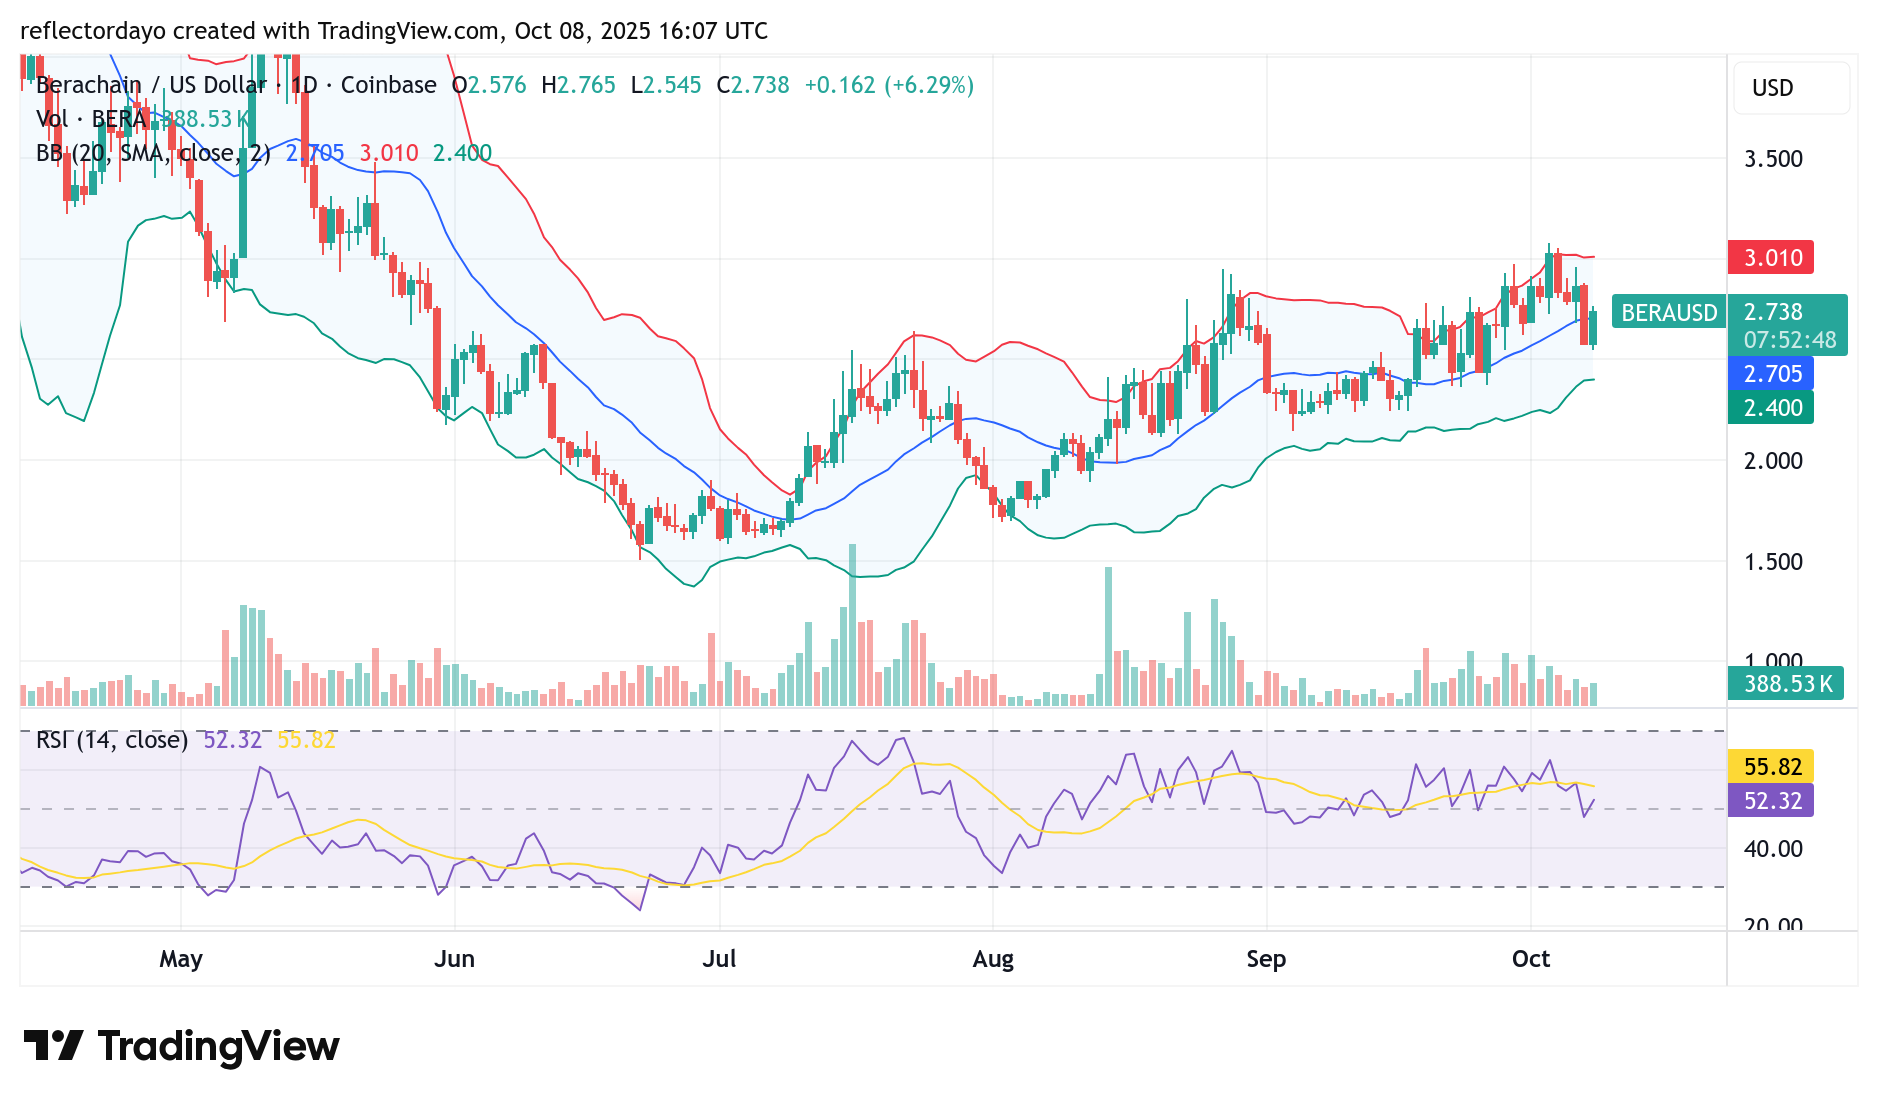
Berachain (BERA/USD) Daily Chart Outlook
Berachain traders may have first identified the $3.00 price level as a formidable resistance zone on August 28, when a bullish rally nearly pushed the market to peak at this level. Following that initial rejection, it became evident that bearish sentiment was building around the $3.00 mark.
On October 4, the price once again surged toward this resistance but was rejected, confirming the persistence of selling pressure in that region. Initially, the bulls attempted to sustain the market around the $2.80 level, but during yesterday’s trading session, a strong bearish breakout occurred, forming a bearish marubozu candle—a clear indication that the bears dominated the market throughout the day.
Today, however, the bulls have regained partial control since the market opened. Despite this, their approach remains cautious, as reflected by the formation of a conservative bullish candle. The Relative Strength Index (RSI) reading of 52 further suggests a state of equilibrium in market momentum, signaling indecision between buyers and sellers at the current stage.
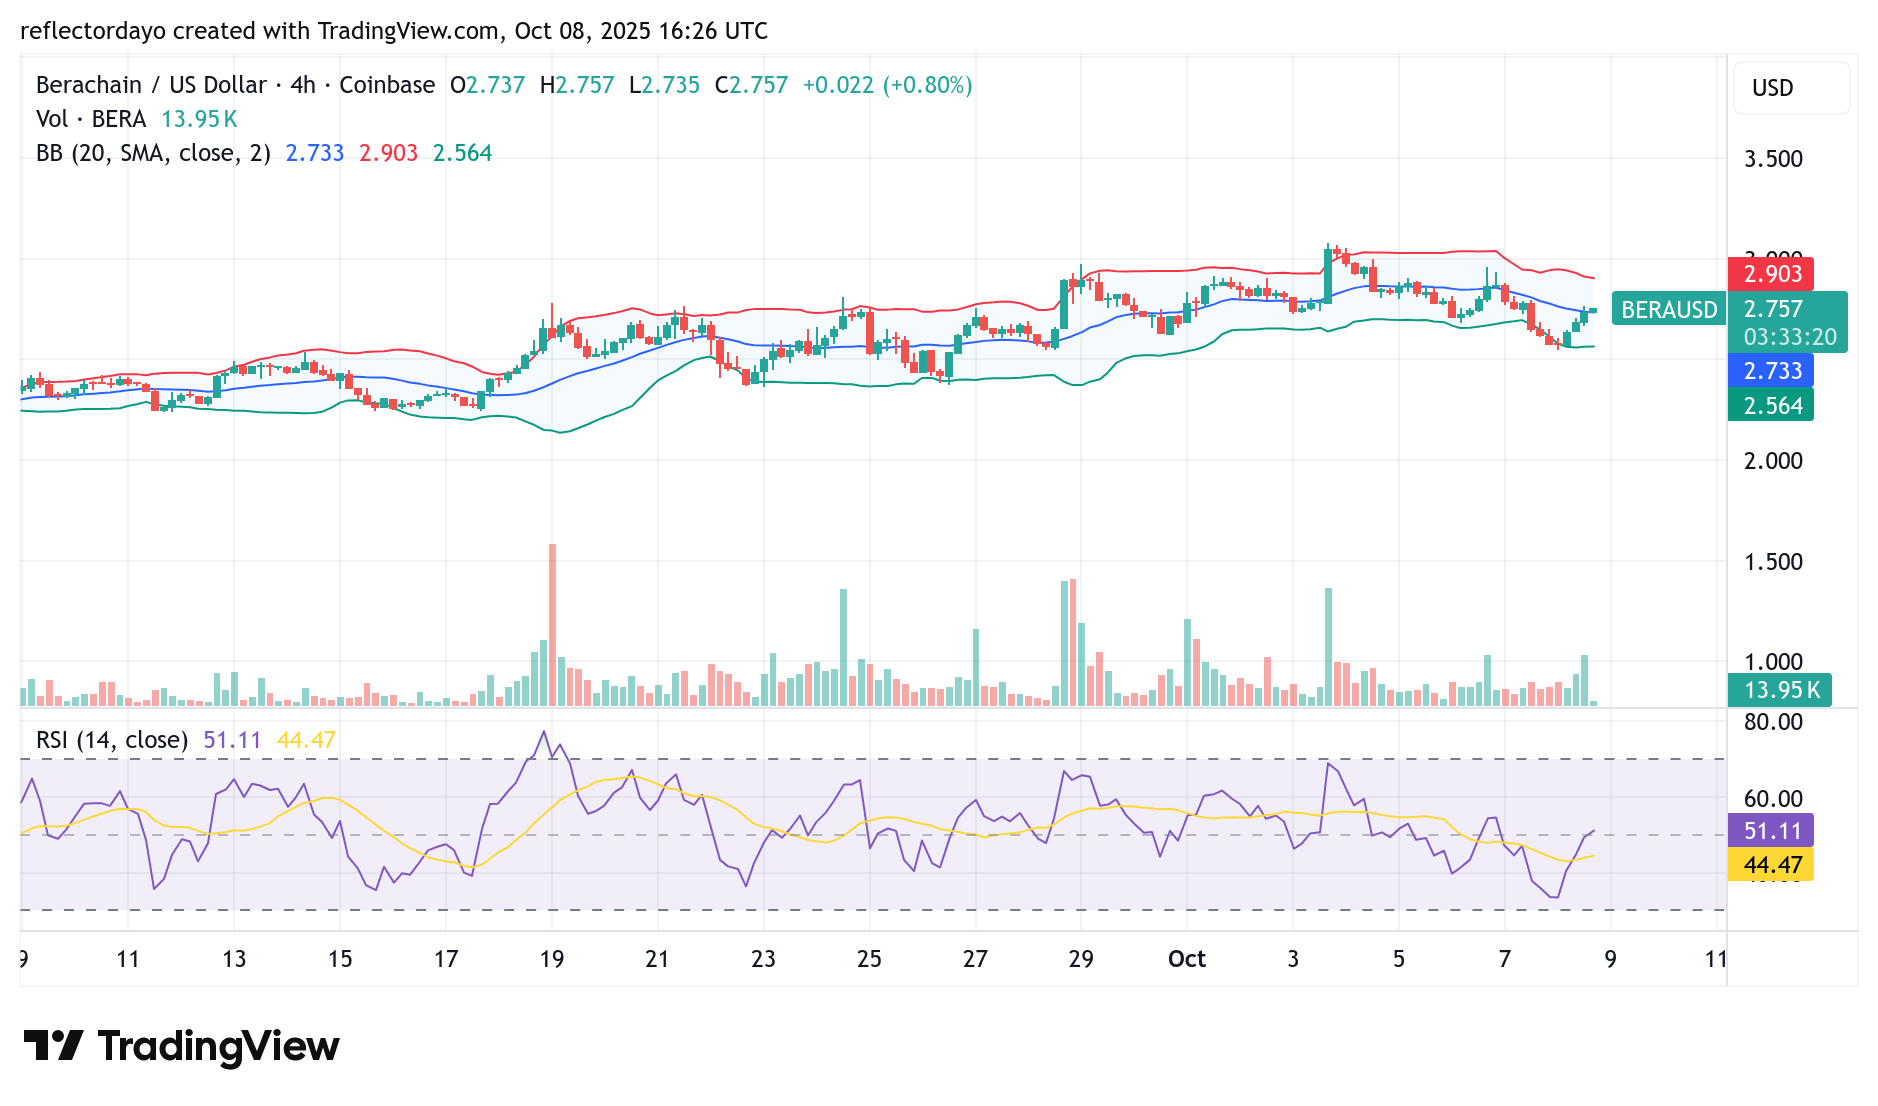
BERA/USD 4-Hour Chart Outlook
Will Berachain sustain a breakout above the $3.00 price level? From the perspective of the 4-hour timeframe, the Bollinger Bands indicate that the market is currently in a consolidation phase. This suggests that the bullish momentum has encountered significant resistance around the $3.00 level.
At this stage in the crypto signal, price action may continue to consolidate as bearish sentiment gradually weakens. Once selling pressure diminishes, a potential rebound could occur—possibly leading to a breakout above the $3.00 threshold if bullish momentum strengthens further.