Sonic (S/USD) Rebounds Strongly from the $0.23 Low
Estimated Reading Time: 2 minutes
Don’t invest unless you’re prepared to lose all the money you invest. This is a high-risk investment and you are unlikely to be protected if something goes wrong. Take 2 minutes to learn more

For an extended period, the $0.30 price level acted as a solid support zone against bearish pressure in the Sonic (S/USD) market. However, persistent selling activity around this level eventually triggered a breakdown on September 19. Following the breach, bearish momentum intensified, driving a sharp selloff that pushed the market below the $0.25 support and established a bottom at $0.23 on September 26.
This dip created an attractive buying opportunity for traders, prompting renewed market interest and fueling a rebound from the recent low.
Sonic (S/USD) Market Data
- S/USD Price Now: $0.30
- S/USD Market Cap: $862 million
- S/USD Circulating Supply: 2.88 billion S
- S/USD Total Supply:
- S/USD CoinMarketCap Ranking: #93
Key Levels to Watch
- Resistance: $0·32, $0.34, $0.36
- Support: $0.26, $0.24, $0.23
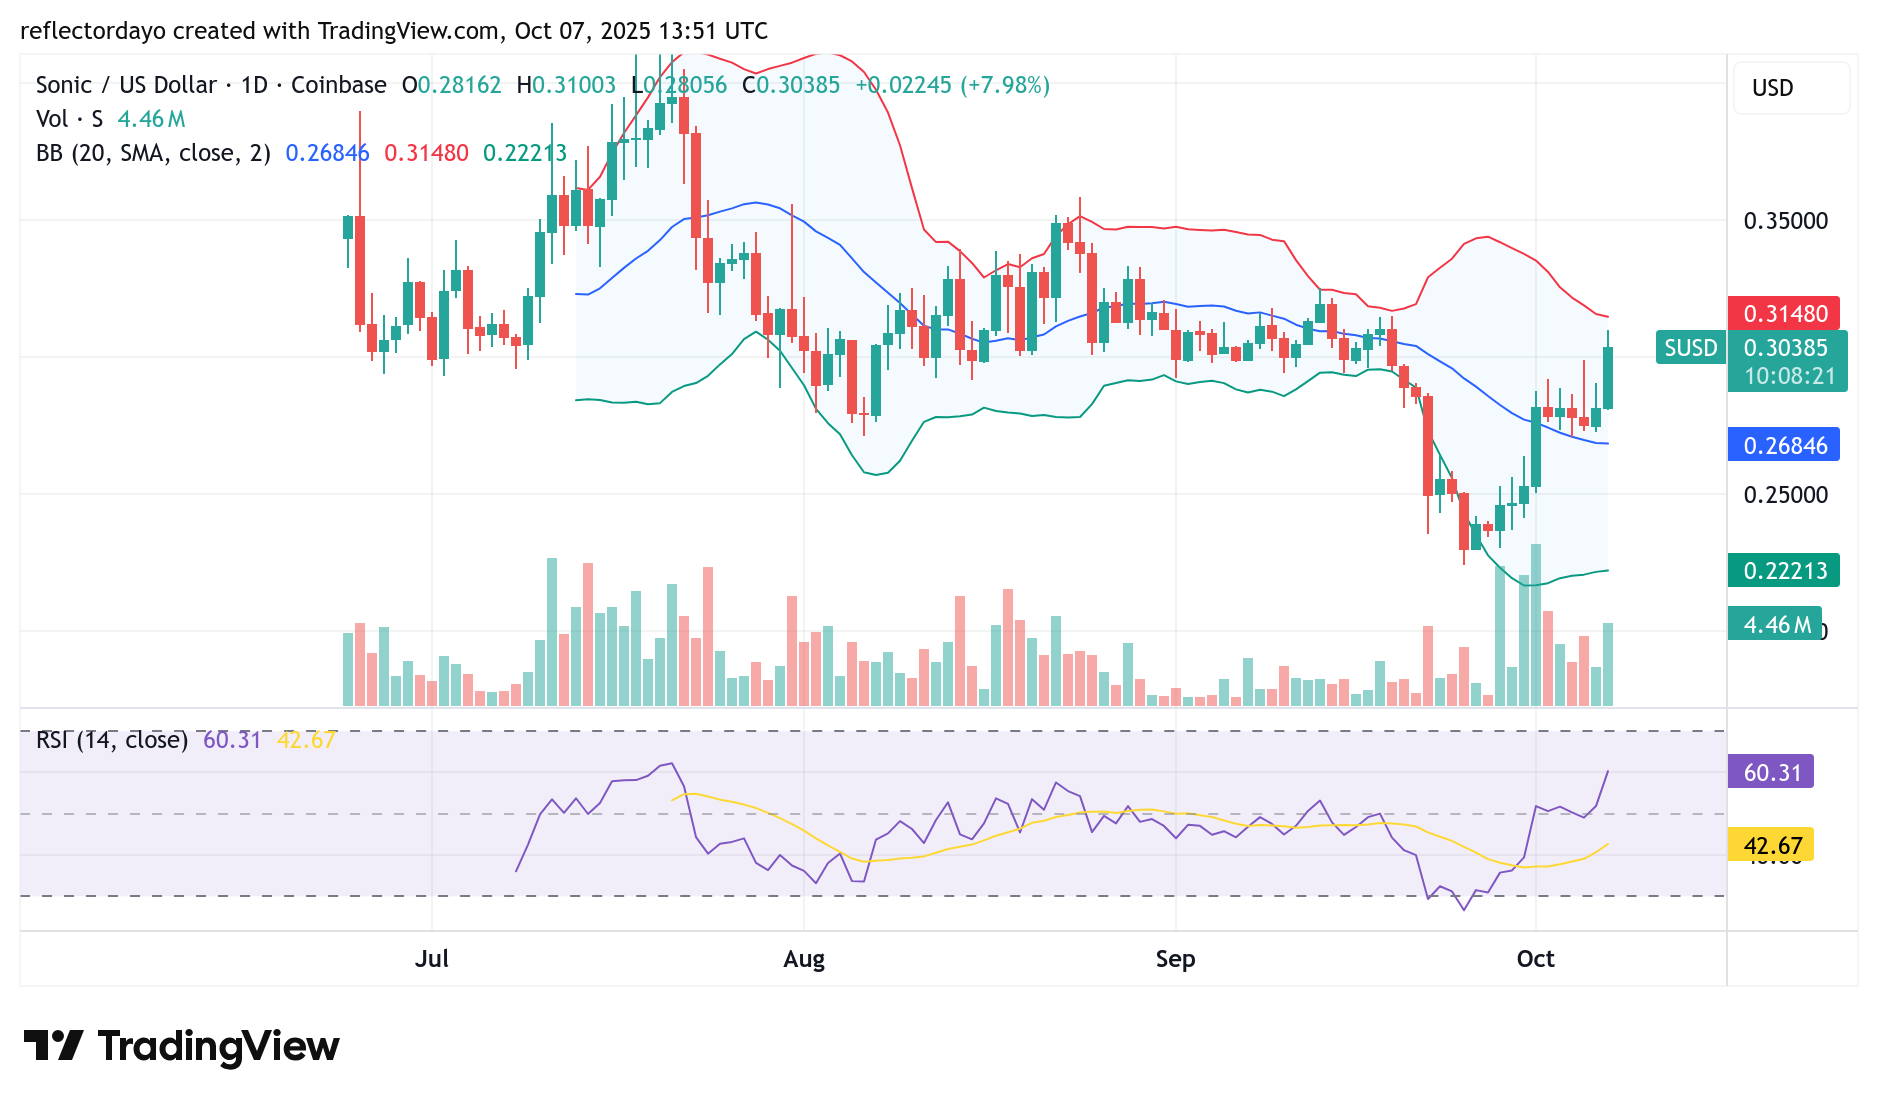
Sonic (S/USD) Daily Chart Outlook
From an indicator perspective, the Sonic market has recorded notable trading activity, as reflected by a sizeable volume histogram indicating active participation among traders. However, the current histogram appears slightly weaker compared to previous ones, suggesting a degree of caution as the price approaches the critical $0.30 resistance level.
The existing market volatility may also be contributing to this hesitation, with some profit-taking expected—particularly from traders who entered long positions near the $0.23 support zone. Despite a minor pullback following the breakout above $0.30, strong bullish sentiment continues to support price stability above this key level.
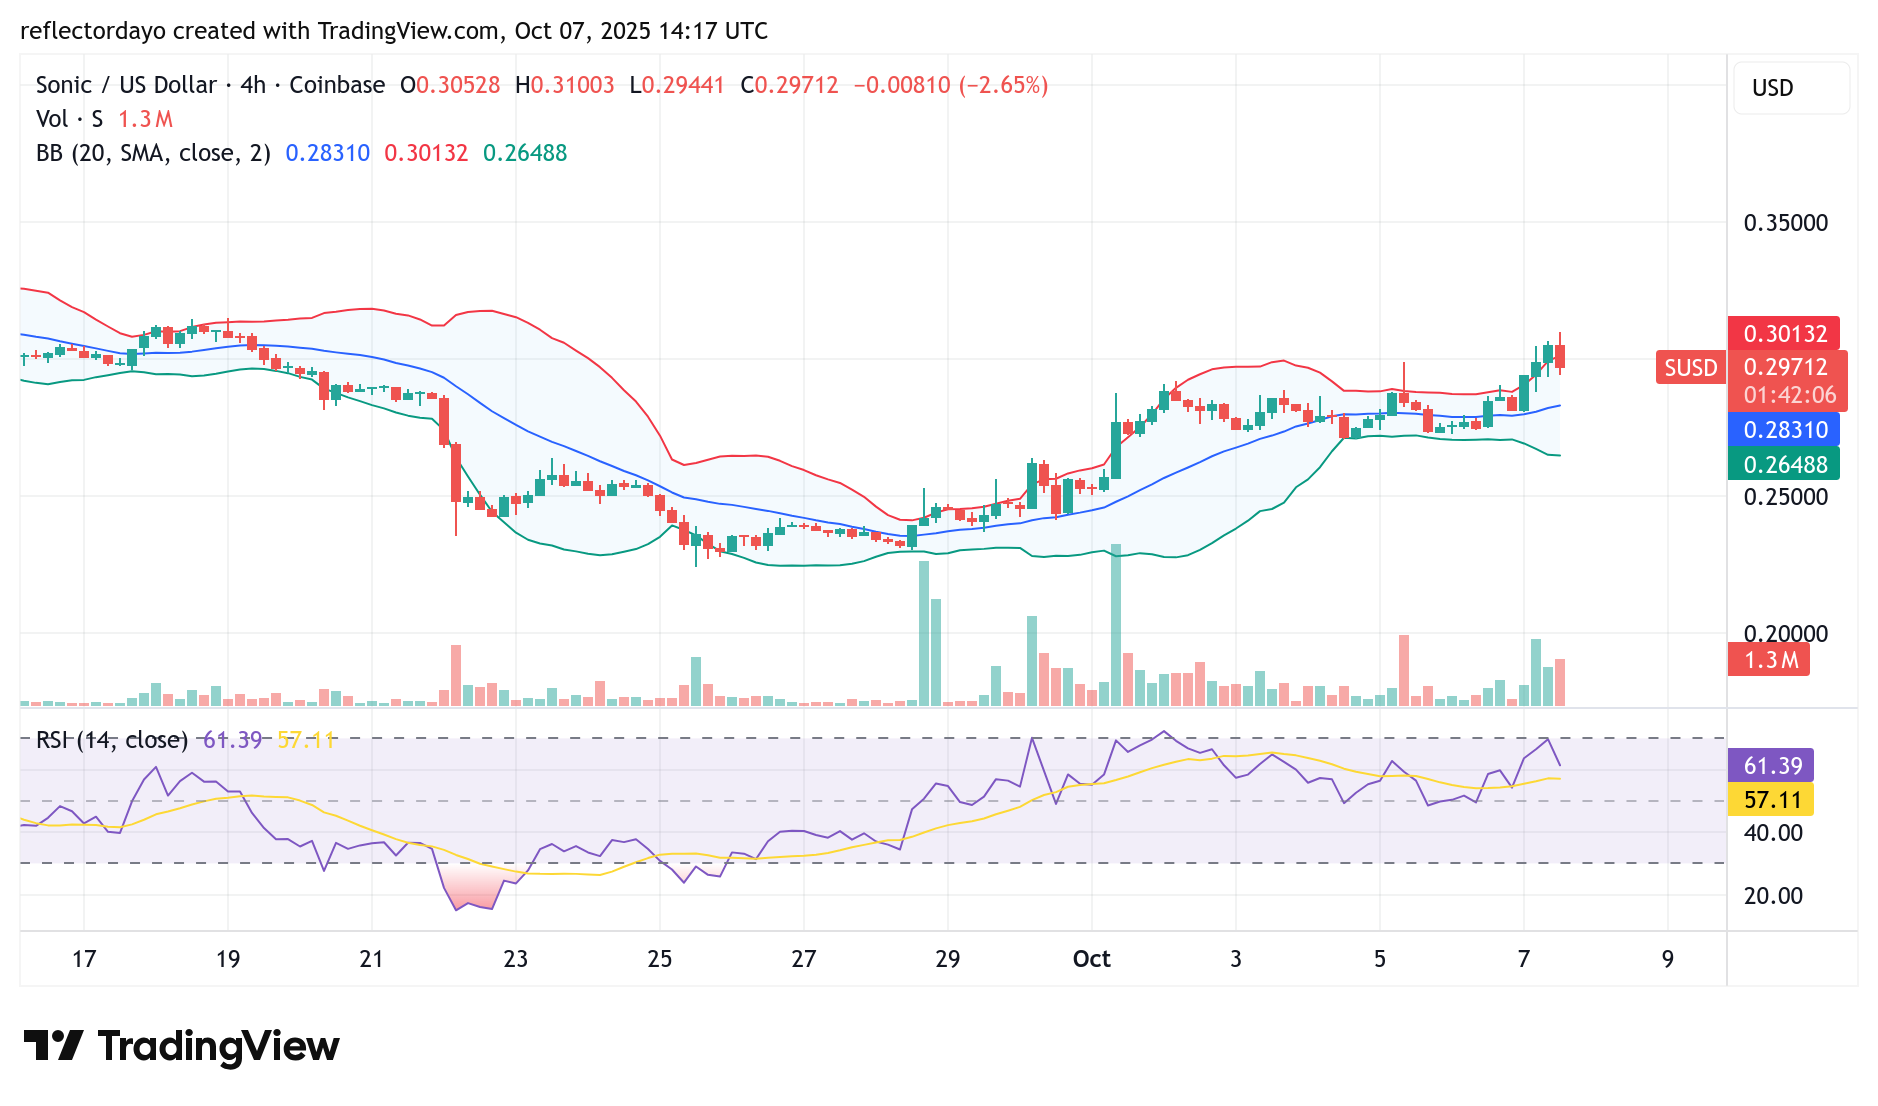
S/USD 4-Hour Chart Outlook
Can the bulls sustain the market above the $0.30 price level? This question becomes crucial as indicators begin to signal potential exhaustion within the bullish momentum. The Bollinger Bands suggest that the market may be entering an overextended phase; however, price action continues to reflect notable bullish resilience.
If buyers manage to maintain this upward drive, they could gradually weaken bearish sentiment around the $0.30 zone, paving the way for a potential breakout toward the $0.35 price level.