COTI Market (COTI/USD): Bulls Eye a Reclaim of the $0.05 Level
Estimated Reading Time: 3 minutes
Don’t invest unless you’re prepared to lose all the money you invest. This is a high-risk investment and you are unlikely to be protected if something goes wrong. Take 2 minutes to learn more

Although the COTI market has remained relatively active, with noticeable price swings between demand and supply zones, it largely stayed in a consolidation phase for some time. This phase persisted until late September, when the price broke below a key support level at $0.048, extending the decline to around $0.0426.
From this pivotal point, bullish momentum resurfaced, driving the market upward. The price now faces resistance at the $0.05 level — a zone that previously served as a stronghold for buyers but has since turned into a key bearish barrier.
COTI (COTI/USD) Market Data
- COTI/USD Price Now: $0.0495
- COTI/USD Market Cap: $119 million
- COTI/USD Circulating Supply: 2.4 billion COTI
- COTI/USD Total Supply: 2.4 billion COTI
- COTI/USD CoinMarketCap Ranking: #344
Key Levels to Watch
- Resistance: $0·050, $0.055, $0.060
- Support: $0.040, $0.035, $0.030
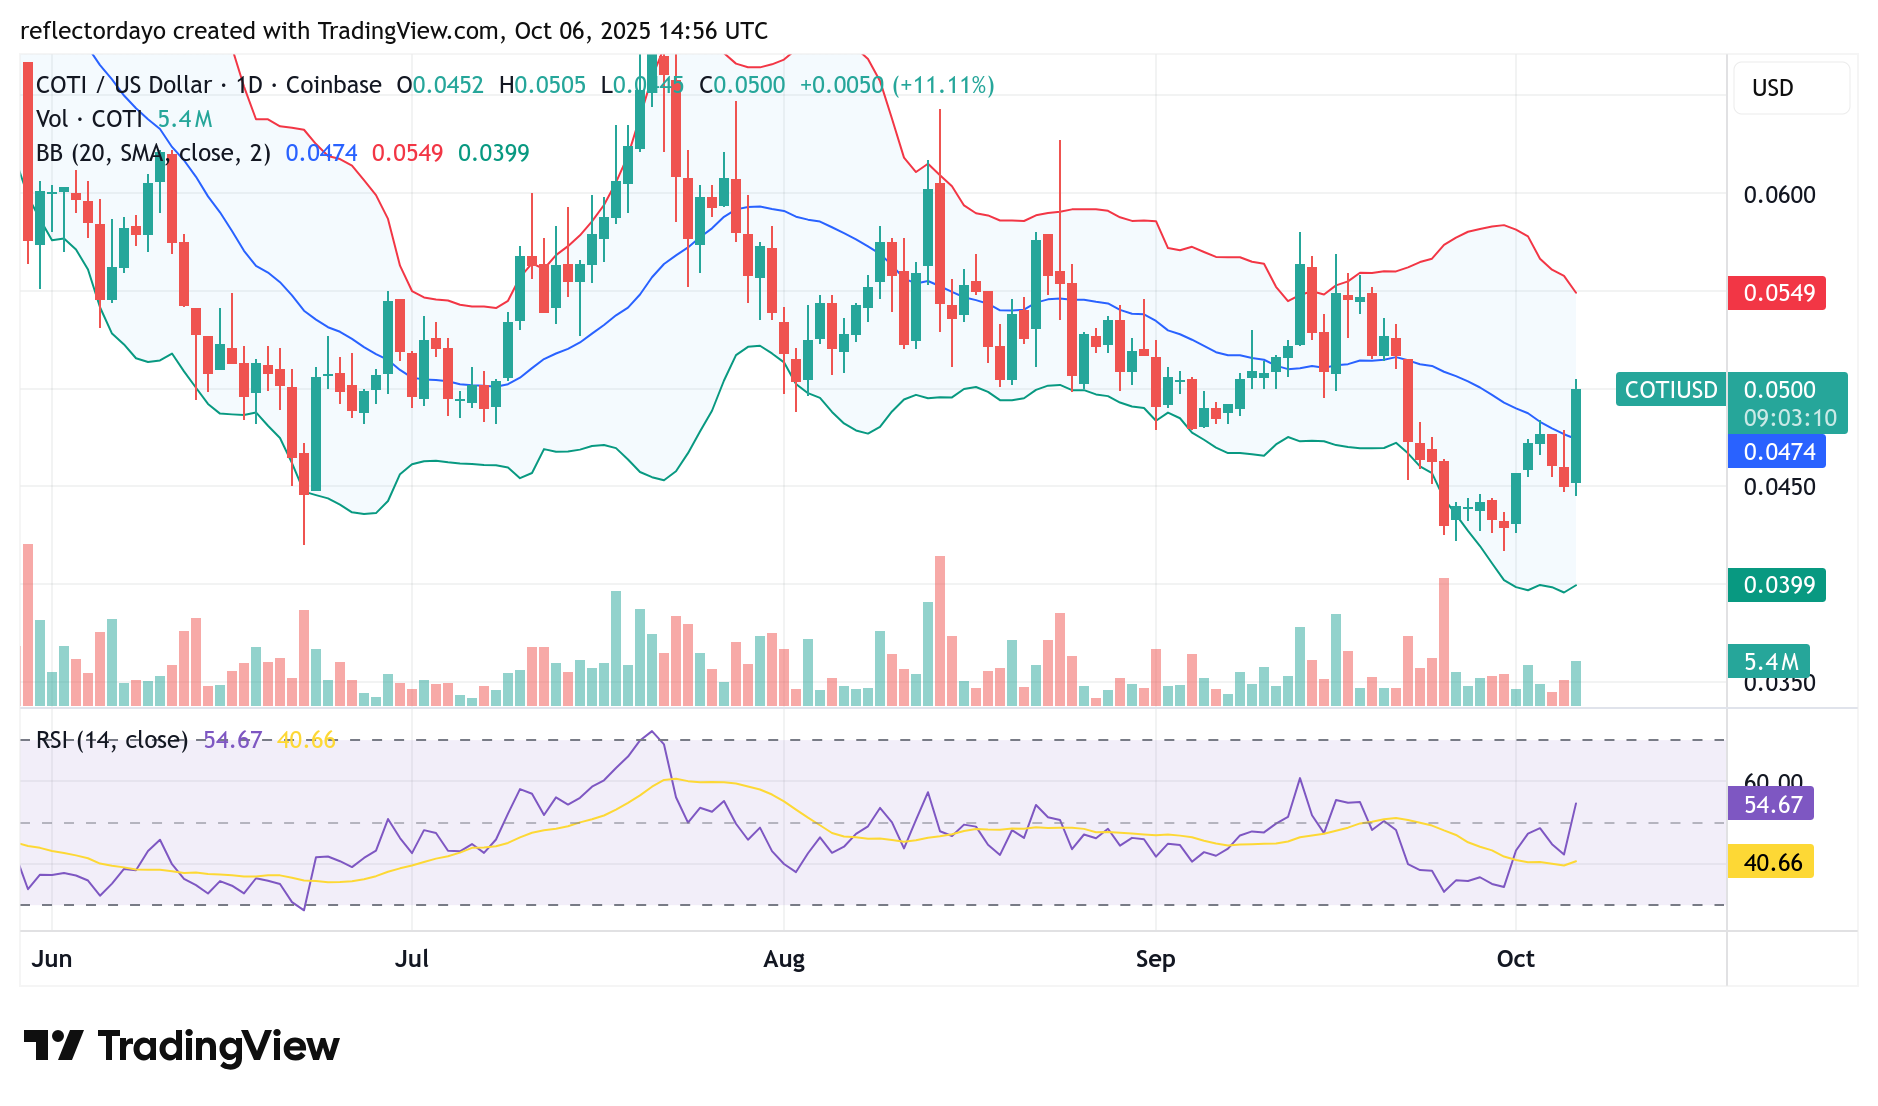
COTI Market (COTI/USD) Daily Chart Outlook
When the bearish COTI market breached the key $0.048 support level on September 23, it triggered a surge in downward volatility as selling pressure intensified. However, the decline attracted optimistic traders around the $0.0427 level, who capitalized on the heightened volatility to push prices upward. The ensuing bullish momentum lifted the market toward the $0.05 mark.
This crypto signal area is particularly significant, as traders have historically shown caution around it. With the Bollinger Bands indicating wide bandwidth, market volatility remains elevated—suggesting that the $0.05 level may serve as a formidable resistance zone.
Nonetheless, the bulls have demonstrated resilience. If this momentum continues through subsequent trading sessions, a breakout above $0.05 could occur, potentially reinforcing bullish sentiment and inviting increased market participation.
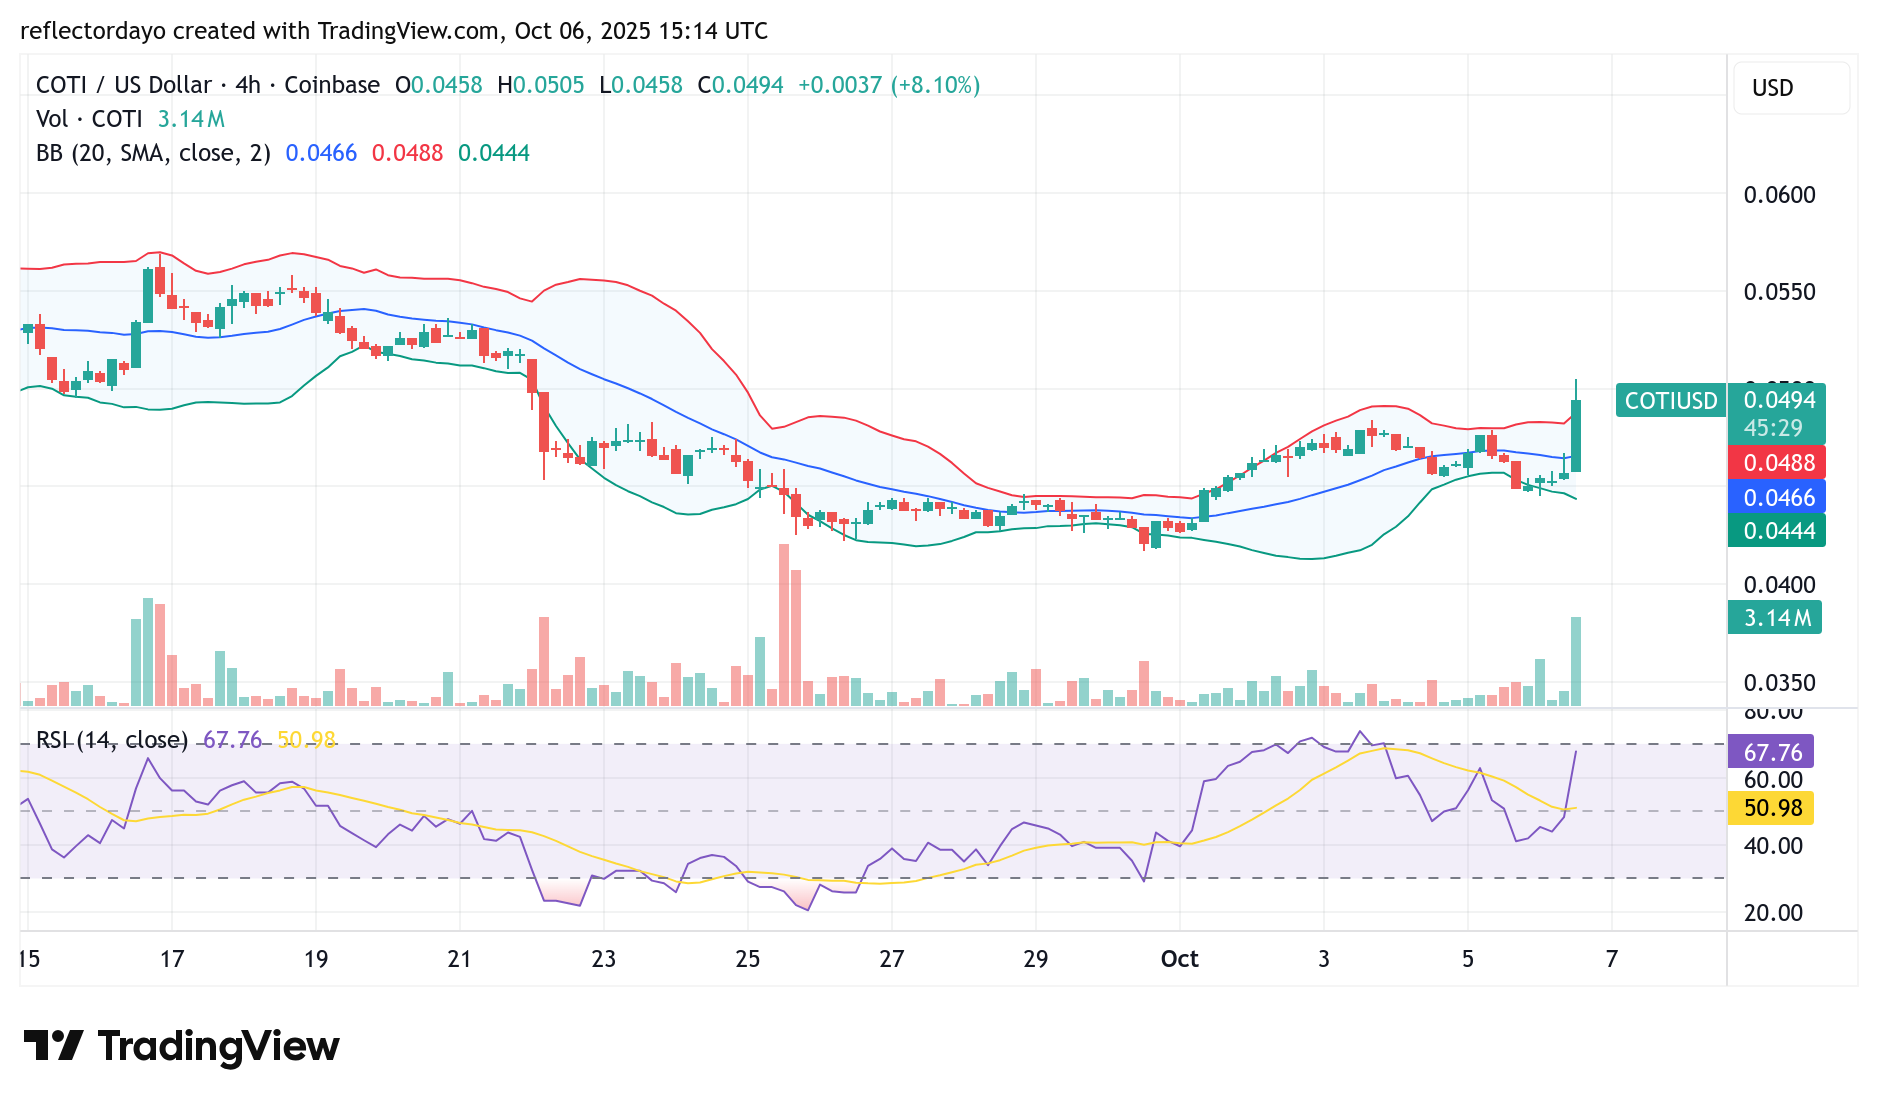
COTI/USD 4-Hour Chart Outlook
Zooming into a smaller timeframe, the 4-hour chart reveals a strong level of buying interest today, as reflected by the prominent bullish candlestick and the accompanying high trading volume. The RSI’s near-vertical rise underscores intense buying momentum, though it also suggests the potential for a corrective pullback.
However, minor corrections have already occurred, while underlying bullish sentiment continues to strengthen—sustaining the size and momentum of the current green candle. It appears that renewed buying interest is absorbing much of the expected correction that typically follows a retest of the $0.05 resistance level.
If bullish pressure persists, the $0.05 barrier may eventually give way, paving the path for an upside breakout and potential continuation of the upward trend.