Litecoin (LTC/USD) Market Is on a Hike, Holding a Bullish Path
Estimated Reading Time: 3 minutes
Don’t invest unless you’re prepared to lose all the money you invest. This is a high-risk investment and you are unlikely to be protected if something goes wrong. Take 2 minutes to learn more
Litecoin Price Prediction – September 19
A lot of transaction activities have taken place between the points of around $60 and $70 in the trade operations connecting Litecoin versus the US Dollar, as the situation currently depicts that the crypto-economic market is on a hike, holding a bullish path.
Given the current situation, buyers appear to be dominating the sellers’ response as the price fails to decrease any further than the lower reported figure in the previous paragraph. A resistance has been conjectured around the point of $70 against the capacity being put up by bulls presently in the market. In conclusion, investors can still use purchasing and holding strategies.
LTC/USD Market
Key Levels:
Resistance levels: $75, $80, $85
Support levels:$55, $50, $45
LTC/USD – Daily Chart
The LTC/USD daily chart reveals the crypto-economic market is on a hike, holding a bullish path in the range-bound zones of $60 and $70.
The positioning of the indicators specifies that the major overhead barrier-trading lines are set between $70 and $80 points. $65.749992 and $76.437601 values have been the points at which the 14-day SMA trend line and the 50-day SMA trend line are. The stochastic oscillators are in the overbought region, slightly positioning from 90.22 to 91.58.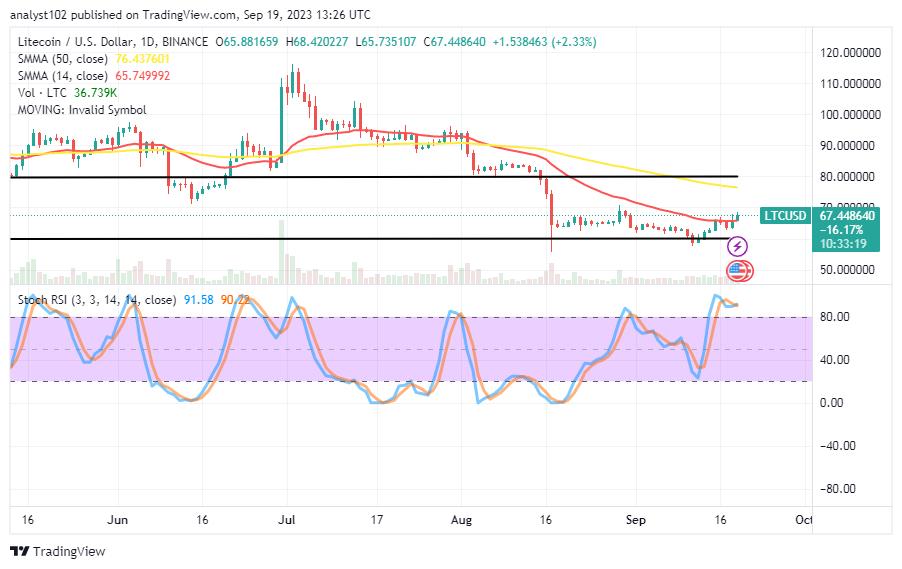
Should investors and long-position placers collaborate at this juncture in the LTC/USD market operations?
Buyers in the LTC/USD trade operations could join the current moves toward the $70 alongside investors, provided that they would exercise patience without overleveraging their positions as the cryptocurrency market is on a hike, holding a bullish path.
Even though stochastic oscillators have indicated that an overbought perspective has materialized, the distance from the lower-trading place isn’t that great to induce such extreme concern in traders, especially investors. We believe that points below the upper range of $70 should be considered dipping zones that are worthwhile for buying against any motions in an attempt to bounce against them later.
Bears may linger for a while to reclaim their positions toward or near the location of the 50-day SMA in the scenario associated with the prediction of the market reverting around the smaller SMA trend line. Lower 4-hour and 1-hour trade charts will be useful for observing the early return of a transaction.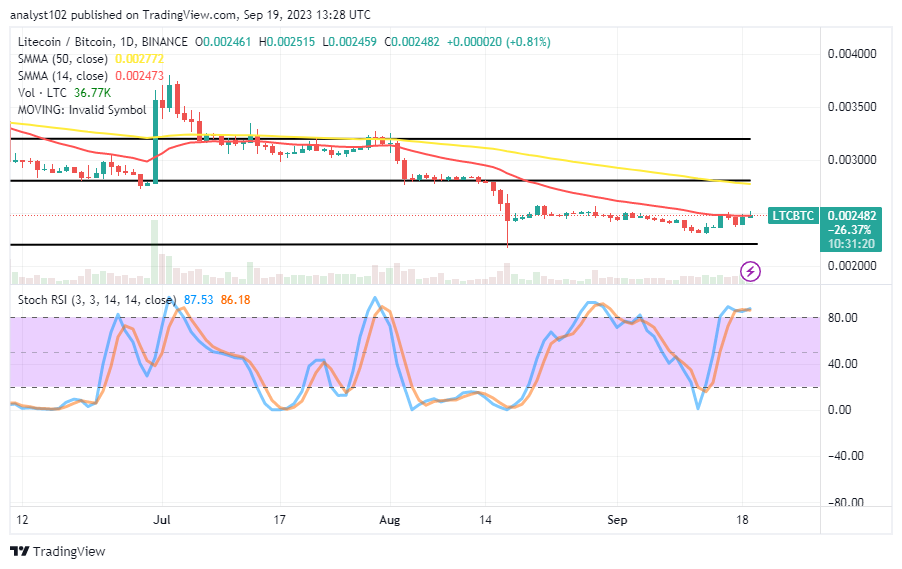
LTC/BTC Price Analysis
In contrast, Litecoin appears to be on a hike relatively against the trending ability of Bitcoin, as it is holding a bullish path in range-bound spots.
Variant trading candlesticks have appeared around the 14-day SMA trend line, which is positioned below the 50-day SMA trend line. The stochastic oscillators have entered the overbought region, positioning between 86.18 and 87.53 values, according to the capacity measurement. The pushes to the north side appear unreasonable with light forces based on the current reading posture of the volatility index as of this technical piece.
Note: Cryptosignals.org is not a financial advisor. Do your research before investing your funds in any financial asset or presented product or event. We are not responsible for your investing results.
You can purchase Lucky Block here. Buy LBLOCK