Cardano (ADA/USDT) Struggles to Maintain Upside Momentum
Estimated Reading Time: 3 minutes
Don’t invest unless you’re prepared to lose all the money you invest. This is a high-risk investment and you are unlikely to be protected if something goes wrong. Take 2 minutes to learn more
ADA/USDT Long-term Analysis: Ranging
The market for Cardano against the Tether over the previous trading session has shown significant volatility. However, the recent price action suggests the pair is experiencing difficulty in maintaining an uptrend. This can be seen in the failure to maintain a significant gain after hitting above the $1.000 level and the quick correction to the current level.
Recently, the weekly price action suggests rejection at a higher level, signaling a weakness among the bullish traders and a potential breakdown if the price fails to stay above the immediate support level.
Currently, Cardano trades at $0.8677, recording over a 23% decline in price with billions of traded volumes for the week.
Technical Indicators
Major Resistance Levels: $0.8700, $0.9500, and $1.000
Major Support Levels: $0.8605, $0.7466, and $0.5926
Cardano Technical Analysis
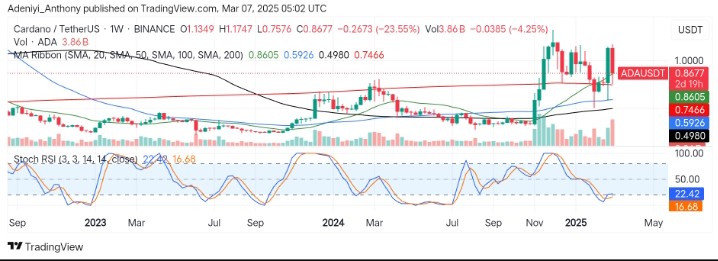
The analysis of Cardano against Tether on a weekly timeframe shows that the pair is at a critical juncture with difficulty in sustaining a move to the north. However, the price is slightly above the Moving Average Ribbon, suggesting the current struggle between market participants for market dominance.
On the other hand, the Stochastic RSI indicates the market is oversold, as the lines are positioned below the 30-mark level. However, the blue line is above the orange line, but failure to cross upward could signal continued downside movement.
To this end, as the pair sees volume spike these days, the pair could record a further dip towards $0.5926. Conversely, a break above $0.8700 could indicate rekindled bullish strength.
ADA/USDT Analysis: What’s Next?
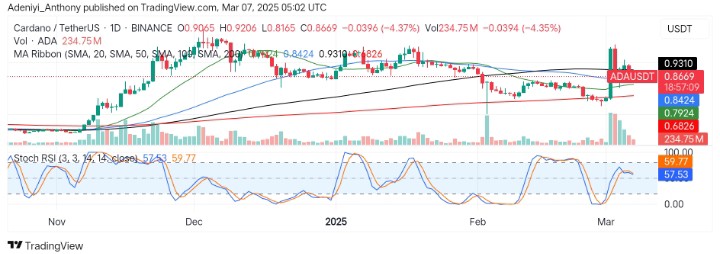
On the daily timeframe, ADA/USDT is currently in a make-or-break region as the price hovers within the Moving Average Ribbon, while the oscillator signals that neither the buyers nor the sellers are in control of the market.
If the price fails to reclaim $0.9000, further selling pressure could push it towards $0.6826. To this end, a close at the current level is important for the buyers to maintain control; otherwise, a break below the immediate dynamic support could lead to further correction.
You can purchase crypto coins here. Buy LBlock