Can Lucky Block (LBLOCK) Continue Its Uptrend Momentum?
Estimated Reading Time: 3 minutes
Don’t invest unless you’re prepared to lose all the money you invest. This is a high-risk investment and you are unlikely to be protected if something goes wrong. Take 2 minutes to learn more

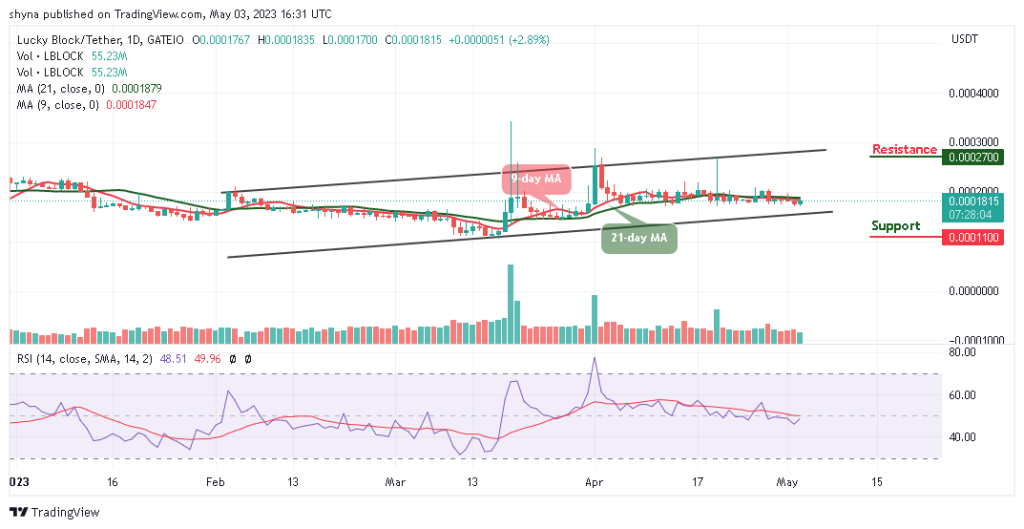
Lucky Block (LBLOCK) has been showing a promising recovery from its recent lows, demonstrating resilience in the face of market fluctuations. With its all-time high recorded at $0.005471, the current price reflects a substantial rise from its lowest point of $0.000009049307, up by 103.91%. As LBLOCK continues to gain traction, traders and investors are keenly watching for signs of sustained upward momentum.
Daily Chart Analysis of Lucky Block
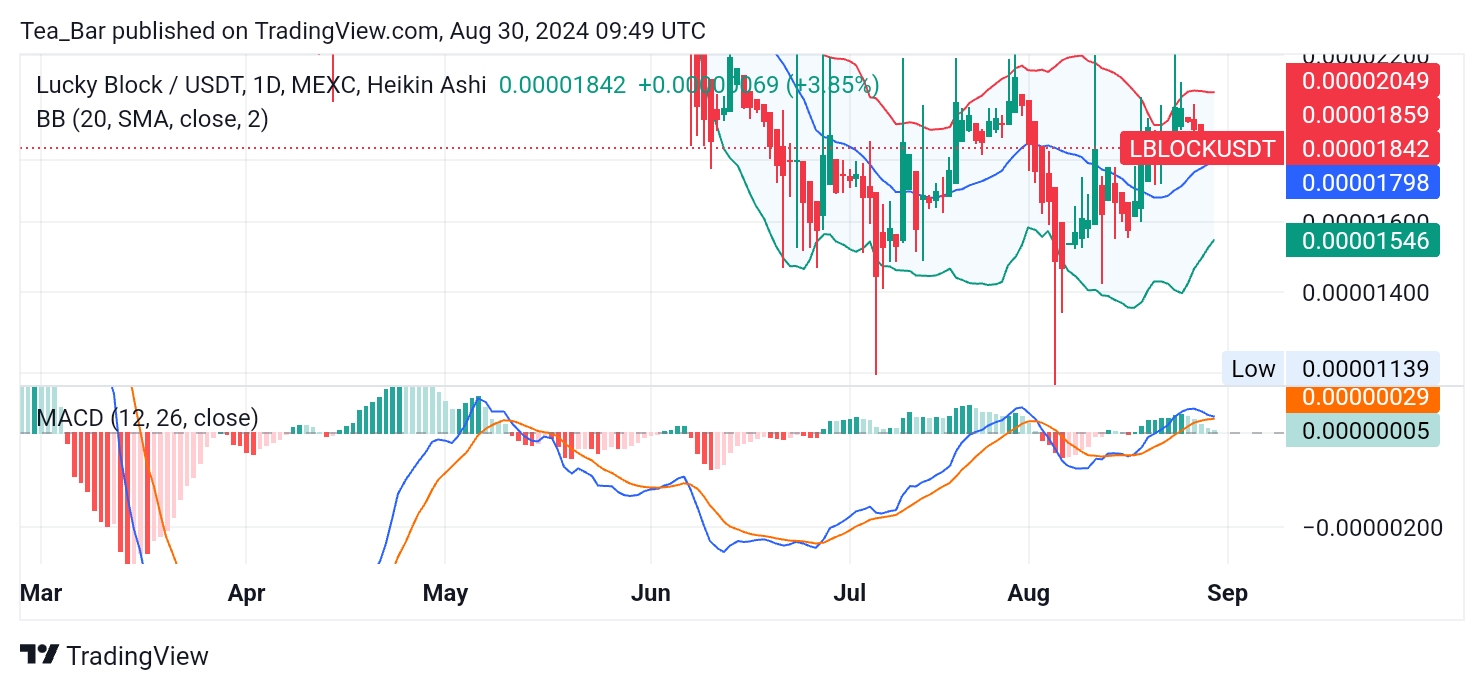
Lucky Block is currently trading at around $0.00001842, marking a 3.85% increase for the day. The Bollinger Bands suggest a moderate level of volatility, with the upper band at $0.00002049 and the lower band at $0.00001139. The price’s proximity to the upper band indicates that there may be further room for upward movement.
The MACD on the daily chart further reinforces the positive outlook. The MACD line remains above the signal line, which is a strong indicator of continued upward momentum. However, the histogram is beginning to show signs of weakening, which could suggest a potential consolidation phase soon.
4-Hour Chart Analysis
On the 4-hour chart, LBLOCK is maintaining its upward momentum, with the current price at $0.00001859, just above the middle Bollinger Band at $0.00001752. This position indicates that LBLOCK is in a healthy uptrend, with support around $0.00001752 and resistance at $0.00001882.
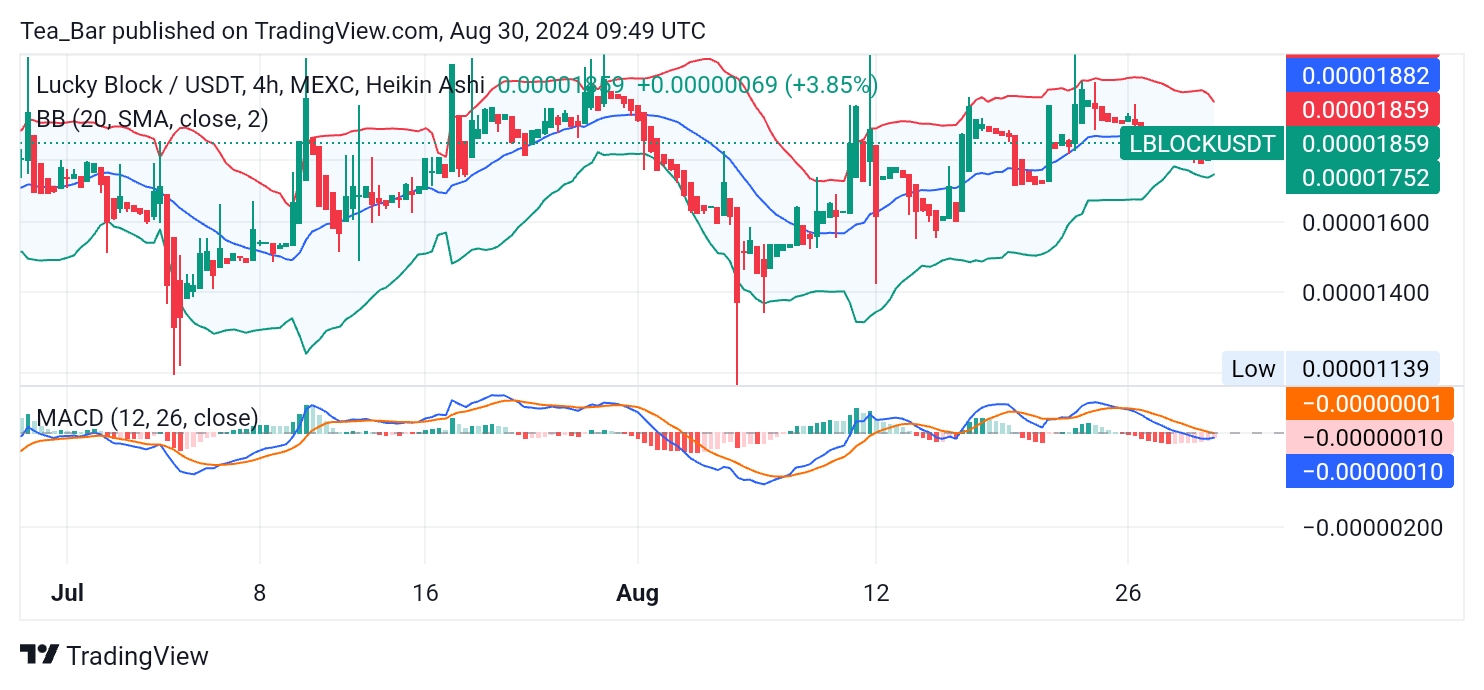
The MACD on the 4-hour chart also supports a bullish outlook, with the MACD line comfortably above the signal line. The histogram is showing increasing positive momentum, suggesting that LBLOCK could continue to push higher in the short term.
Conclusion
Lucky Block has shown strong resilience, currently up by 103.91% from its all-time low. The technical indicators suggest that LBLOCK could continue its upward movement, although traders should be cautious of potential consolidation near resistance levels. Overall, LBLOCK appears to be in a strong position to maintain its bullish trend.
You can purchase Lucky Block here. Buy LBLOCK.