Solana (SOL/USD) Market Moons, Touches $30 Resistance
Estimated Reading Time: 4 minutes
Don’t invest unless you’re prepared to lose all the money you invest. This is a high-risk investment and you are unlikely to be protected if something goes wrong. Take 2 minutes to learn more
Solana Price Prediction – October 21
There have been significant add-ons of purchasing power by bulls against bears’ trade ability in the activities involving Solana and the US currency, as the current condition portends that the cryptoeconomic market moons touches the $30 resistance.
The middle Bollinger Band trend line served as the center of the market’s sideways moves between October 10 and October 15. The sellers lost the catalysts from the $22 line on the sixteenth day, which slowly increased the buying pressure to the point of $30. Following that, a small reversal movement has been created, causing the price to trade at about $28.97 with a positive percentage rate of 7.10.
SOL/USD Market
Key Levels:.
Resistance levels:$32, $34, $36
Support levels: $25, $23, $21
SOL/USD – Daily Chart
The SOL/USD daily chart reveals that the crypto business moons touch the $30 resistance level, which is situated above the positional value of the Bollinger Band trend line.
The Bollinger Band trend lines are positioned at $27.00 and $23.42, and their lower part is at $19.84 in those arrangement orders. The stochastic oscillators have placed from 79.16 to 100.00 values, signaling that some rising forces in the subsequent operations will probably face restistanes as bulls will be attempting to push beyond the current trade line of $29.96.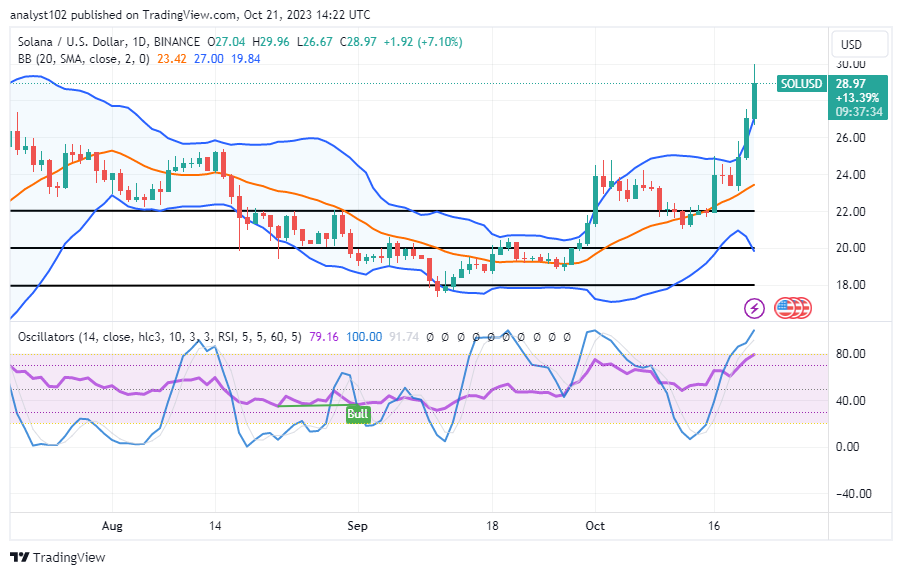
Should investors in the SOL/USD market operations be doubtful of seeing the price appreciation beyond its present high point of $29.96?
Approximately, the valuation of the SOL/USD trade has reached a high of $30 in today’s activities, given that the cryptoeconomic market moons from around the level of $22, touching the resistance level of the larger figure.
At this moment, it doesn’t look like long-term traders should simply place new long-term orders in the hopes of making significant profits in a short period of time. Long-term investors should still be encouraged to keep up their buying and holding behaviors until the next, presumably rising bargain cycle fully recovers.
Sellers are on the verge of tightening their belts in order to gain a good entry, as there has been a hint of a resistance line around the value of $30, along with a lighter reversal movement mode from the point. They needed to proceed with caution in case there was another rapid shoot-up later.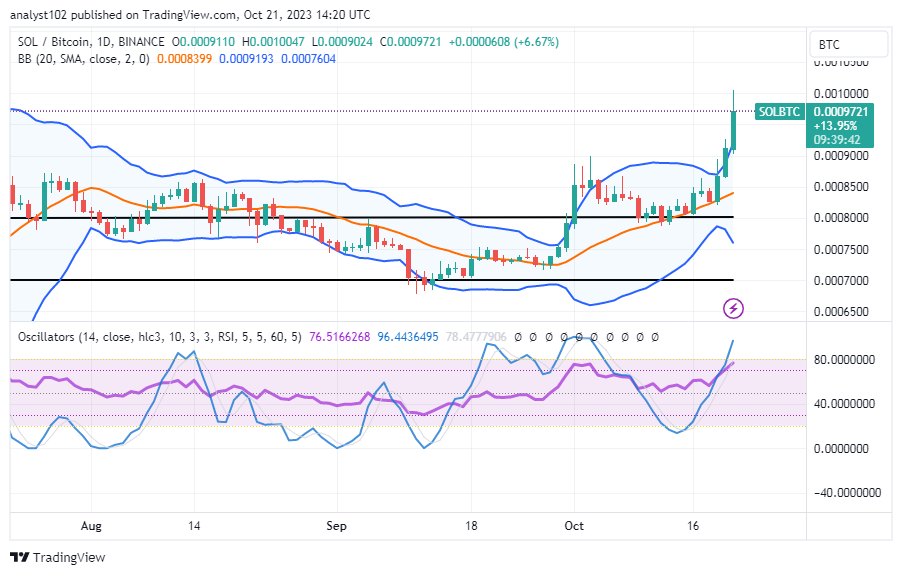
SOL/BTC Price Analysis
In contrast, Solana’s business economy moons against the purchasing power of Bitcoin, touching the notable resistance line above the trend line of the upper Bollinger Band.
The northern stochastic oscillators are located between 76.5166268 and 96.4436495. Due to the appearance of bullish candlesticks during the past three days, the upper Bollinger Band trend line has been moving to the north side. The important baseline where bulls have been able to increase their momentum has been the middle Bollinger Band trend line. In order to checkmate persistent uprising forces, the countertrading instrument will need to figure out a means to press back against the foundational crypto economy at a higher place above the Bollinger Bands.
Note: Cryptosignals.org is not a financial advisor. Do your research before investing your funds in any financial asset or presented product or event. We are not responsible for your investing results.
You can purchase Lucky Block here. Buy LBLOCK