Solana (SOL/USD) Trade Faces Rejections, Risking a Correction
Estimated Reading Time: 4 minutes
Don’t invest unless you’re prepared to lose all the money you invest. This is a high-risk investment and you are unlikely to be protected if something goes wrong. Take 2 minutes to learn more
Solana Price Prediction – October 8
Since around September 13th, when a smaller bullish candlestick formed on the threshold of $18, subsequent motions have prevailed over some falling situations until the present, when the SOL/USD trade faces rejections predominantly at $24, risking a correction.
Price movers may still attempt to push through some resistance levels despite the psychological trade output being in their favor, with the risk of quickly reversing their position. The market is in the process of moving to the moon’s side, and since the cycle has been established into a positive running type for the foreseeable future, investing may still proceed. However, successive moves will produce some remarkable lows if the price tremblingly reverses between $24 and $22.
SOL/USD Market
Key Levels:.
Resistance levels:$26, $28, $30
Support levels: $20, $19, $18
SOL/USD – Daily Chart
The SOL/USD daily chart showcases that the crypto market faces rejections around the point of $24, risking a correction around the area of the upper Bollinger Band.
The Bollinger Band trend lines are marked at $24.88, $21.21, and $17.53. And they are briefly pointing in the north direction. The stochastic oscillators are gently placed from 65.99 to 71.30, showcasing that a pit stop is tending to crop up. That means actions will be delayed for some time before a definite motion is made.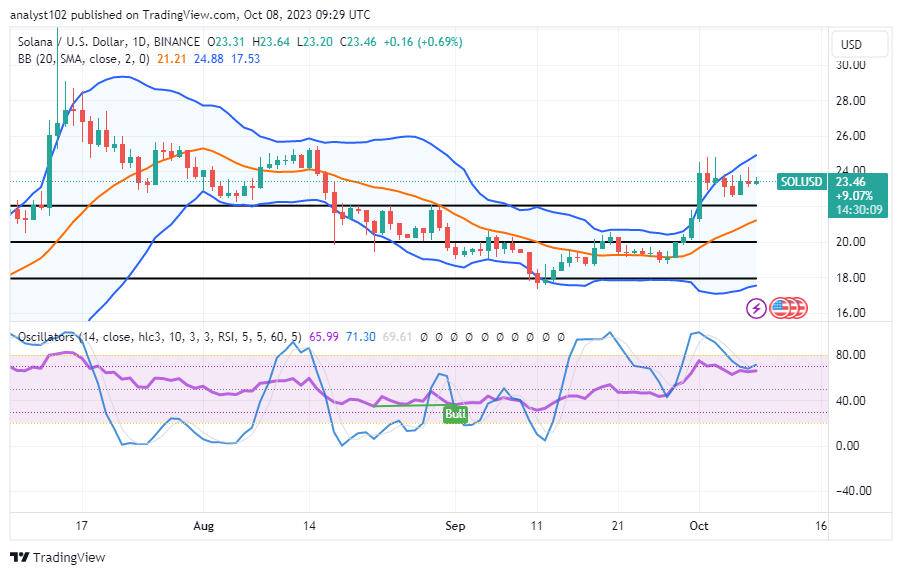
Can the SOL/USD continue its smooth upward running motions in the previous operations against the upper Bollinger Band trend line?
As our expectations would have it, it would be necessary for a pull-up to take place in the operations of the SOL/USD market to exhibit a completion of movement for bulls, given that the SOL/USD trade faces rejections, risking a correction.
Instantaneous execution of buy orders at this time would have to prevent a reversal movement pattern from reaching the $20 level and the middle Bollinger Band trend line. However, if the market soon behaves in that manner, those places will be among the finest reduced points for obtaining respectable buy entries.
Bears may be receiving good opportunities to enter positions near the higher Bollinger Band after a string of rejections has played out. Sellers would need to be on the lookout for active moves to test resistance around $26, coupled with reversal inputs to execute an immediate order, in order to gain some acceptable entries.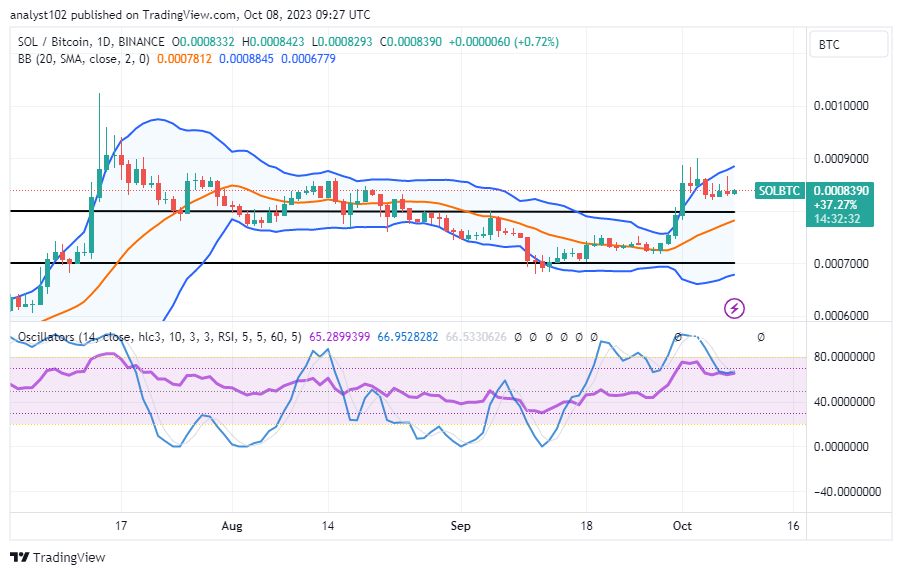
SOL/BTC Price Analysis
In contrast, the Solana trade faces rejections when pairing with Bitcoin, risking a correction as the price is underneath the upper Bollinger Band trend line.
The Bollinger Bands on the north side now have a gap in them. Below the formation of candlesticks signifying the current trade condition, the middle Bollinger Band trend line has made a little northward bend. The stochastic oscillators have aligned themselves to create the values 65.2899399 and 66.9528282 as a result. It shows that the fundamental cryptocurrency could not be able to withstand aggressive pressures that might emerge from its current point of trading in the following volatility motions.
Note: Cryptosignals.org is not a financial advisor. Do your research before investing your funds in any financial asset or presented product or event. We are not responsible for your investing results.
You can purchase Lucky Block here. Buy LBLOCK