Solana (SOL/USD) Trade Sets in a Peak, Wallowing Below $22
Estimated Reading Time: 4 minutes
Don’t invest unless you’re prepared to lose all the money you invest. This is a high-risk investment and you are unlikely to be protected if something goes wrong. Take 2 minutes to learn more
Solana Price Prediction – September 21
Trade reaction activities characterized by the pace by which bulls have been putting up against bears from around a lower-trading point of $18 in the SOL/USD market have set the transaction line, making the crypto-economic trade sets reach a peak, wallowing below the resistance point of $22.
The rate at which sellers have been leaving the exchange environment has not decreased enough to allow for easy climbs back to a large mooning trend; thus, the situation needs to be as it is. Buyers must cautiously gather energy for improved outcomes when executing their entries in light of such sentiment. Long-term investors still have a better chance than short-term ones, though, of seeing a future increase in the value of their assets.
SOL/USD Market
Key Levels:.
Resistance levels:$22, $23, $24
Support levels: $17, $16, $15
SOL/USD – Daily Chart
The SOL/USD daily chart reveals that the crypto-economic trade sets in a peak averaging the trend line of the bigger moving average, wallowing below the resistance line of $22.
The 50-day SMA trend line is at $20.89, above the $19.81 point of the 14-day SMA trend line. The stochastic oscillators are in the overbought region, trying to cross back slightly downward from 90.78 to 82.17 points. That condition showcases that a retracement movement is relatively in the offing.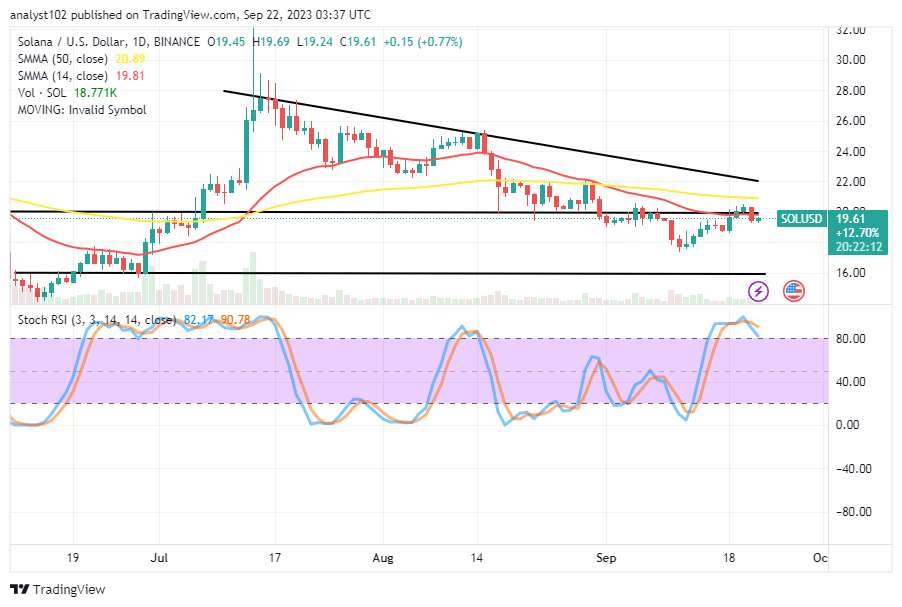
Is it still a decent opportunity for purchasers to legitimately launch an entry given that the SOL/USD market has an overbought report outlook?
In the first place, the current overbought reported trade situation in terms of weight capacity pushing in the SOL/USD market has been vastly obtained owing to the fact that bulls have kept to a tight mode of slow-and-seedy rate, given that the crypto trade sets in a peak, wallowing below the $22 resistance level.
In order to allow for a timely-sensitive pull and a better desired entry for buyers to leverage on easily, a volatile motion is now required to change to a noticeably lower arena. However, as the market is beginning to enter a bullish-trending market operations cycle, taking positions as a capitalist from this point or even below it to any length could ultimately result in gains.
The 50-day SMA and the $22 resistance level are where bears have the best possibility of sending the market back downward at the present because of the stochastic oscillators’ overbought reading outlook. Because of this, any aggressive comeback against those trade axes without a firm correction will hurt sellers.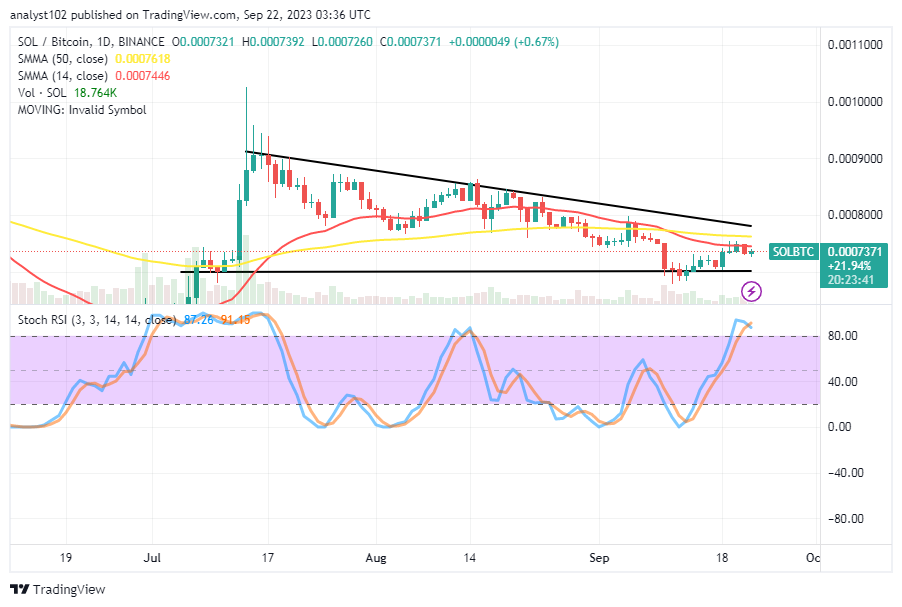
SOL/BTC Price Analysis
In contrast, the Solana market sets in a peak, wallowing below the trend line of the bigger moving average.
When the 14-day SMA indicator is placed in opposition to the 50-day SMA indicator, it confirms that a bearish trading environment is present to some extent. The Stochastic Oscillators are positioned between 91.15 and 87.26 and are overbought. It is necessary to allow the repositioning of the oscillators to feature around lower values to point back with an upward index, even though it appears that there aren’t many downward pressures at this point, in order to determine when the base cryptocurrency will be recovering positively in relation to its quoting cryptocurrency.
Note: Cryptosignals.org is not a financial advisor. Do your research before investing your funds in any financial asset or presented product or event. We are not responsible for your investing results.
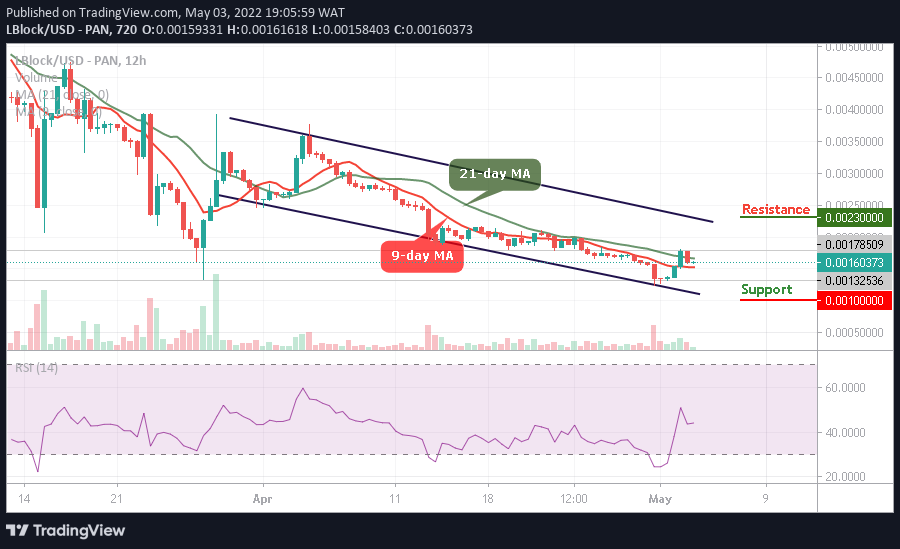
You can purchase Lucky Block here. Buy LBLOCK