Band Protocol (BAND/USD): Aiming for Higher Price Levels
Estimated Reading Time: 3 minutes
Don’t invest unless you’re prepared to lose all the money you invest. This is a high-risk investment and you are unlikely to be protected if something goes wrong. Take 2 minutes to learn more
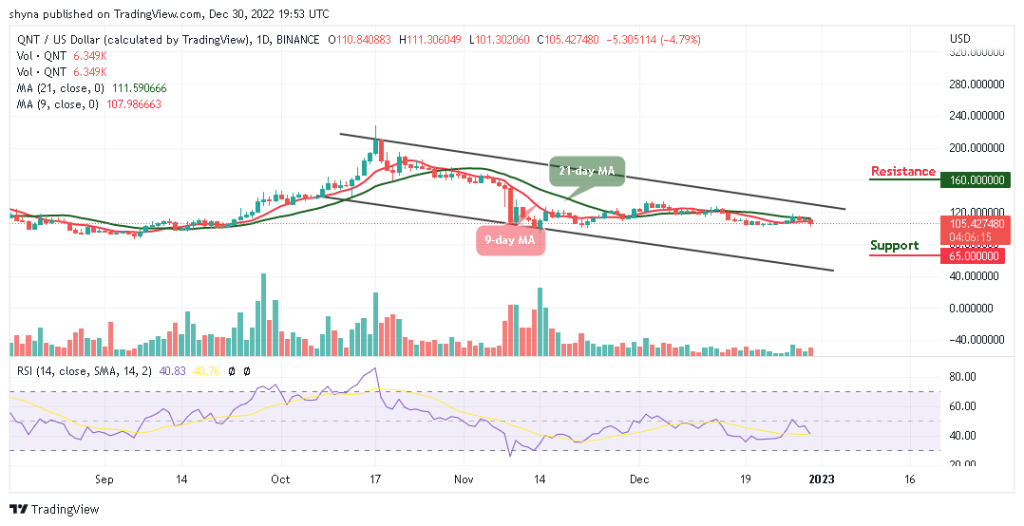
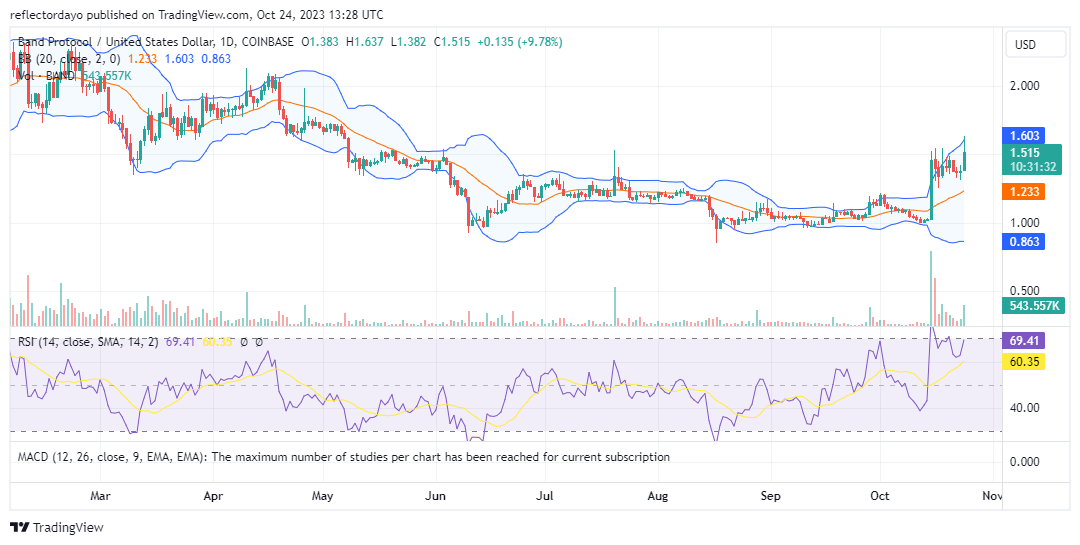
Band Protocol is currently aspiring to achieve higher price levels; however, it appears to be encountering resistance around the $1.50 price point. In May, this particular price level served as a consolidation zone before the market subsequently declined to the $1.00 price threshold. Since then, the $1.50 level has persisted as a significant resistance point. On October 15th, bullish momentum propelled the price towards the $1.50 mark, even testing this level, though it encountered strong bearish pressure. Ultimately, a near-term support level emerged around $1.34, leading to another confrontation between the bulls and bears.
Band Protocol Market Data
- BAND/USD Price Now: $1.52
- BAND/USD Market Cap: $206,623,266
- BAND/USD Circulating Supply: 135,248,253 BAND
- BAND/USD Total Supply: 139,648,253 BAND
- BAND/USD CoinMarketCap Ranking: #136
Key Levels
- Resistance: $1.70, $2.00, and $2.30.
- Support: $1.15, $1.10, and $1.90.
Price Prediction for Band Protocol: The Indicators’ Point of View
The Bollinger Bands indicator currently indicates a bullish market trend, with prices trading above the 20-day moving average. The Band Protocol market also continues to find support at the $1.34 level, with the simple moving average converging towards this support level. Bullish sentiment remains robust, and the market has already breached the $1.50 price zone.
Although the Relative Strength Index (RSI) suggests that the market may be in the overbought region, potentially signaling a trend reversal, it’s important to consider the volume of trade indicator, which suggests that the ongoing bullish sentiment today is strong and sustainable. Additionally, the histogram representing today’s trading activity displays significant investor interest in the market.
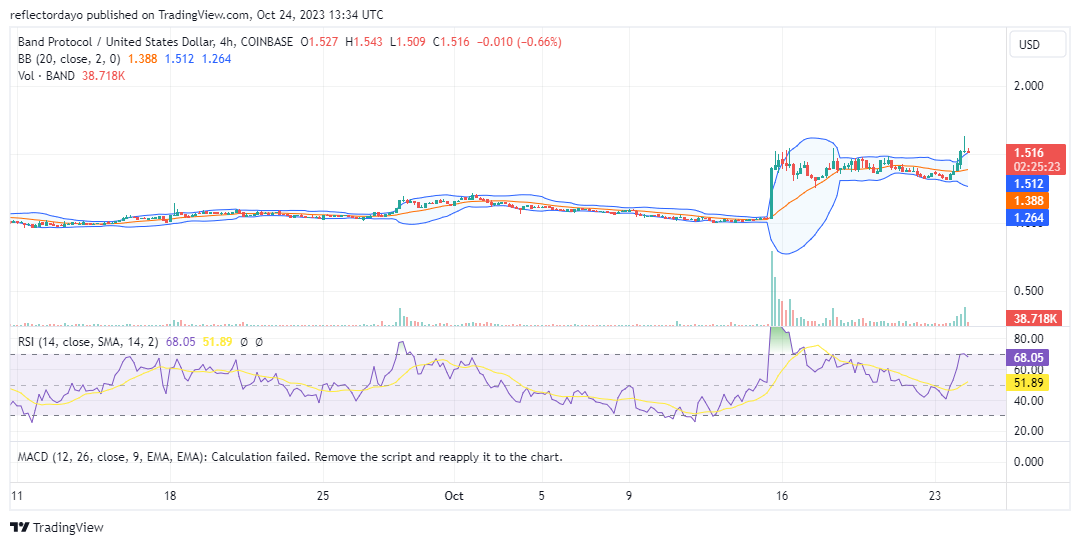
BAND/USD 4-Hour Chart Outlook
Examining the market from a 4-hour chart perspective raises some concerns due to the emergence of a gravestone doji pattern after the market entered the $1.50 price zone. The presence of this gravestone doji in the midst of a bullish market serves as a potential reversal signal. It suggests that, despite the prior bullish momentum at the $1.50 price level, the bulls succumbed to selling pressure, resulting in a market close near its opening price. Nevertheless, there remains optimism for the bullish market. If the bulls manage to establish a support base at the $1.50 price level, it could provide an opportunity to sustain the ongoing bullish trend.