Solana (SOL/USD) Price Is in a Tight Trading Session of $20 or Less
Estimated Reading Time: 3 minutes
Don’t invest unless you’re prepared to lose all the money you invest. This is a high-risk investment and you are unlikely to be protected if something goes wrong. Take 2 minutes to learn more
Solana Price Prediction – June 2
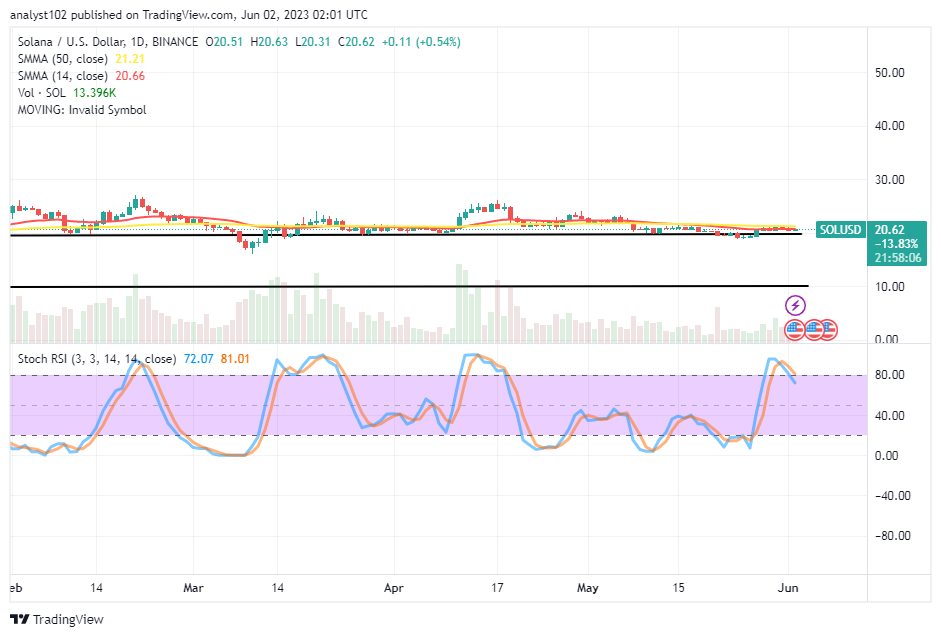
Not so many active price actions have been playing out in the SOL/USD market operations as the crypto-economic price is in a tight trading session of $20 or less over several days. The peak and low-value points in the trading zones were $20.63 and $20.31, respectively, with a minute average percentage rate of 0.54. Our current advice is consistent with the possibility of viewing sellers’ reactivity obscuring the influence of purchasers’ reactions in the interim.
SOL/USD Market
Key Levels:
Resistance levels: $24, $25, $26
Support levels: $17, $16, $15
SOL/USD – Daily Chart
The SOL/USD daily chart showcases the crypto-economic price is in a tight trading session of $20 or less. The situation has featured around the upper trend line drawn below the SMAs. It has showcased that the 14-day and 50-day indicators have conjoined at $20.66 and $21.21, showcasing the extent the market keeps relatively with the trading tools. The Stochastic Oscillators have slightly crossed southbound in the overbought region to maintain 81.01 to 72.07 levels, suggesting a minor decline.
What is the probability index of seeing the SOL/USD market skyrocketing over the $20 upper range zone?
It would be an unguarded thought technically to presume a near jump over in the wake of increasing the SOL/USD market operations from its present capacity point as indicated by the Stochastic Oscillators, given that the crypto-economic price is in a tight trading session of $20 or less at the moment. Therefore, bulls will have to exercise some degree of caution for a while toward having a formation that will go with the lower-reading posture of the Oscillators before thinking of joining the crypto business.
The technical analyses article had one drawback: sellers had to carefully examine the actions to drive down the cryptocurrency that did not carry weight. In light of that reasoning, sellers should exercise caution while taking positions within the current trading force structure.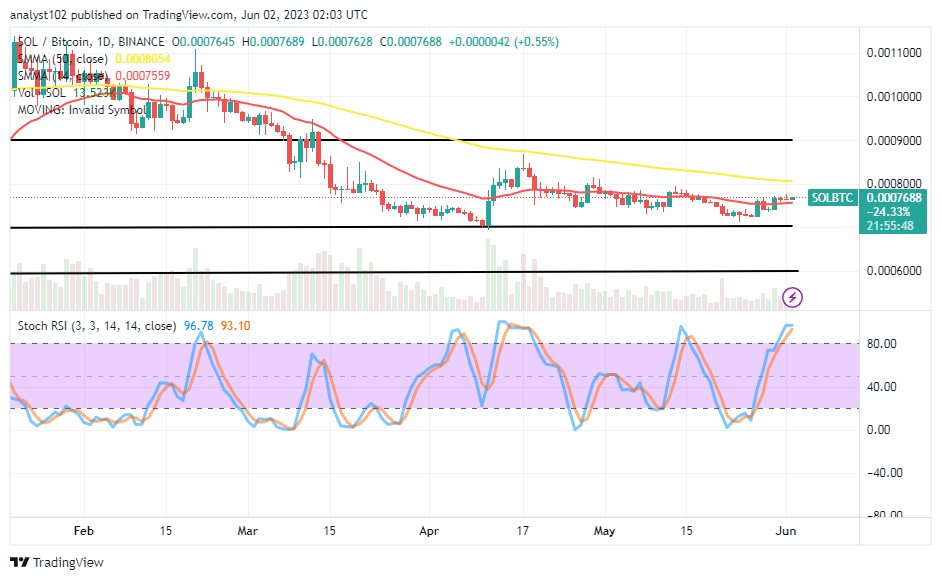
SOL/BTC Price Analysis
Contrasting Solana’s trending stances with Bitcoin, the former trading instrument is in a tight trading session around the trend line of the smaller SMA in the last few days. In front of the 50-day SMA trend line is the 14-day SMA trend line. Price could soon reach a top near the smaller SMA trading indicator. The Stochastic Oscillators are in the overbought region with postulated positions ranging from 93.10 to 96.78. That demonstrates that the base cryptocurrency is approaching a point where it will soon have to shift down versus its counter-trading cryptocurrency.
Note: Cryptosignals.org is not a financial advisor. Do your research before investing your funds in any financial asset or presented product or event. We are not responsible for your investing results.
You can purchase Lucky Block here. Buy LBLOCK