Solana (SOL/USD) Market Is Hovering Around $20
Estimated Reading Time: 3 minutes
Don’t invest unless you’re prepared to lose all the money you invest. This is a high-risk investment and you are unlikely to be protected if something goes wrong. Take 2 minutes to learn more
Solana Price Prediction – May 26
A line of persistent lows in the SOL/USD trade has led to a financial recording that the crypto-economic market is hovering around $20. Most of the transactions have been under a falling force with a recovery struggle signal within the zones of $19.57 and $19.10 at a 0.88% positive. Indications have been surfacing on a gradual moving process that might not be too attractive to long-position takers as even as it is at this moment.
SOL/USD Market
Resistance levels: $24, $25, $26
Support levels: $17, $16, $15
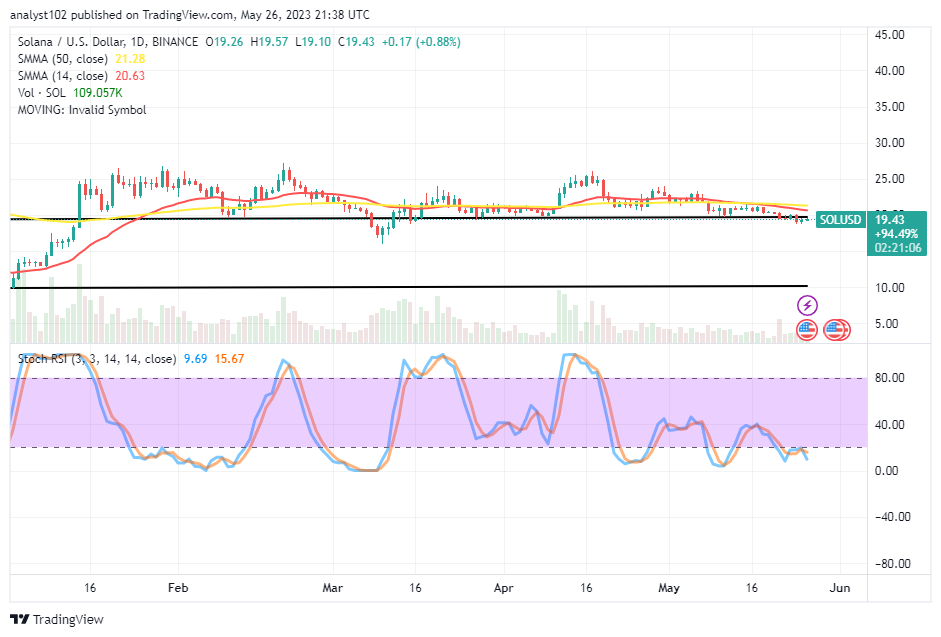
SOL/USD – Daily Chart
The SOL/USD daily chart showcases the crypto-economic market is hovering around $20, closely underneath the trend lines of the SMAs. The 14-day SMA indicator is at $20.63, below the $21.28 point of the 50-day SMA indicator. The Stochastic Oscillators have been swinging within the variant levels from the 40 to the oversold region over time. That suggests that short positions are likely to lose money soon.
Will the SOL/USD market operations slow down beneath the SMA’s interception point to the south?
The area of SMA interception to the downside only poses the signal point that the price will have to breach northward for a bullish resumption move confirmation in the long run, as the SOL/USD market is hovering around the spot of $20. A bullish candlestick that will suddenly emerge from those points will allow the buyers to leverage on the buying wall in the long run.
On the downside of the technical analytics write-up, at ties moment, only a consolidation of bearish motions will produce positive results in the wake of seeing the US currency trying to outpace the purchasing power of the cryptocurrency based on the current trading pattern. However, it would be ideal to eschew going for more shirting order positions now.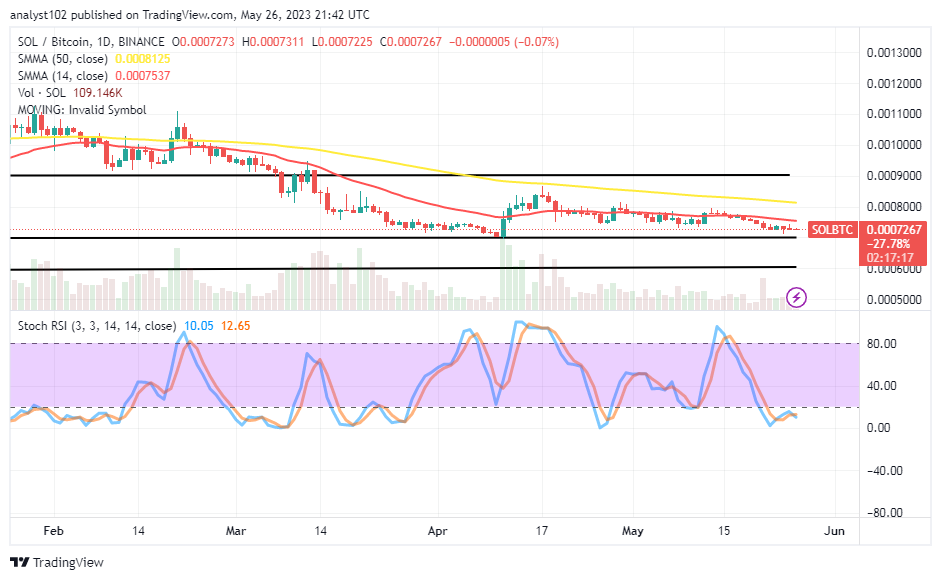
SOL/BTC Price Analysis
Contrasting Solana’s price valuation is hovering in the spot underneath the SMA trend lines following a tinier series of lower lows. The 14-day SMA indicator is beneath the 50-day SMA indicator. The Stochastic Oscillators are in the oversold region, positioning at 12.65 and 10.05. That shows the base crypto has been pushed to a lower point to oppose any fearful push that could be by the counter-trading crypto. The general psychological theory predicts that bulls will win the next.
Note: Cryptosignals.org is not a financial advisor. Do your research before investing your funds in any financial asset or presented product or event. We are not responsible for your investing results.
You can purchase Lucky Block here. Buy LBLOCK