Polkadot Upward Correction Faces Resistance at Level $12.20, May Slide down
Estimated Reading Time: 2 minutes
Don’t invest unless you’re prepared to lose all the money you invest. This is a high-risk investment and you are unlikely to be protected if something goes wrong. Take 2 minutes to learn more
Polkadot (DOT) Long-Term Analysis: Bearish
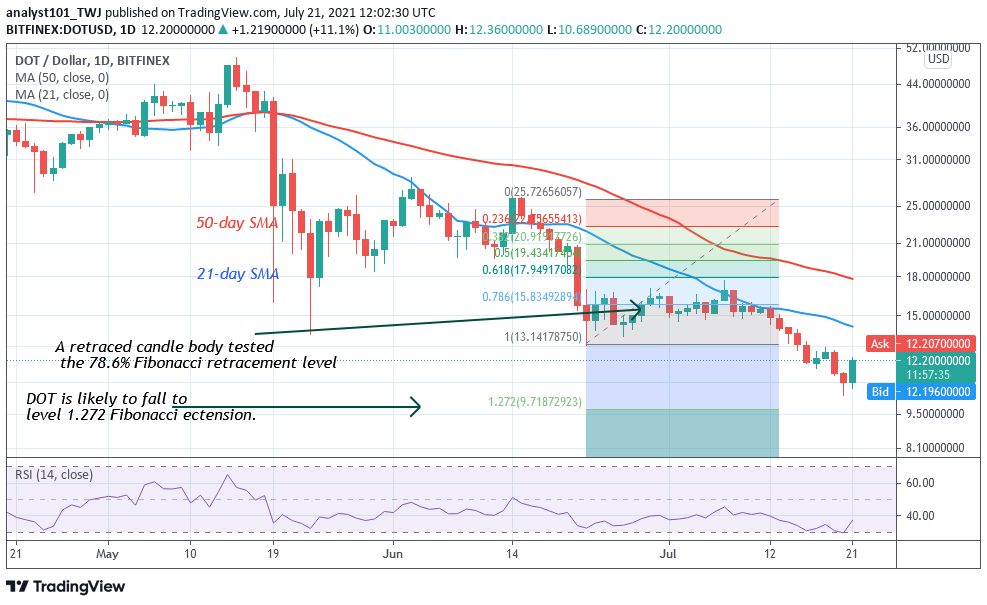
Polkadot’s (DOT) price is making an upward correction after falling to the low of $10.51. The upward correction is approaching the overbought region of the market. However, in the overbought region, sellers will emerge to push prices down. Meanwhile, on June 22 downtrend, a retraced candle body tested the 78.6% Fibonacci retracement level. The retracement indicates that DOT price will fall but reverse at level 1.272 Fibonacci extension or level $9.98. From the price action, DOT’s price has reached a low of $10.36.
Polkadot (DOT) Indicator Analysis
Polkadot is at level 37 of the Relative Strength Index period 14. It indicates that the altcoin is in the downtrend zone and below the centerline 50. DOT price is above the 80% range of the daily stochastic. The altcoin has risen to the overbought region of the market. Therefore, the DOT price is likely to fall. The 21-day and 50-day SMAs are sloping southward indicating the downtrend.

Technical indicators:
Major Resistance Levels – $48, $52, $56
Major Support Levels – $32, $28, $24
What Is the Next Direction for Polkadot (DOT)?
Polkadot has been correcting upward but has risen to the overbought region. Meanwhile, on July 17 downtrend; a retraced candle body tested the 78.6% Fibonacci retracement level. The retracement indicates that DOT price will fall but reverse at level 1.272 Fibonacci extension or level $10.66.

You can purchase crypto coins here. Buy Tokens
Note: Cryptosignals.org is not a financial advisor. Do your research before investing your funds in any financial asset or presented product or event. We are not responsible for your investing results