Litecoin (LTC/USD) Price Loses Momentum Below $70
Estimated Reading Time: 3 minutes
Don’t invest unless you’re prepared to lose all the money you invest. This is a high-risk investment and you are unlikely to be protected if something goes wrong. Take 2 minutes to learn more

Free Crypto Signals Channel
 Free Telegram Channel
Litecoin Price Prediction – August 16
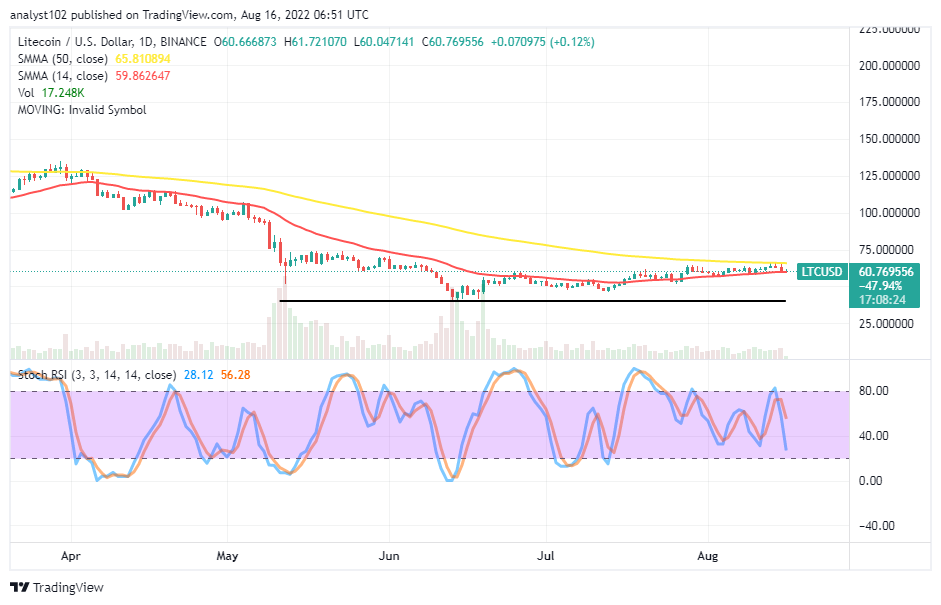
There have been variant tinier ups recently in the LTC/USD market operation that eventually to a resistance point. The crypto-economic price presently loses momentum below the $70 resistance line after hitting a high of $61.72, and it keeps a minute positive percentage rate of 0.12 as of writing.
LTC/USD Market
Key Levels:
Resistance levels: $70, $80, $90
Support levels: $50, $40, $30
LTC/USD – Daily Chart
The LTC/USD daily chart shows the market price loses momentum below the $70 resistance level. The 14-day SMA indicator is at $59.8627 below the $65.8109 point of the 50-day SMA indicator. The horizontal line drew at the $40 support level, showing the critical zone that the market may still have to face in the event of an aggressive re-occurrence of a downward motion in the long run. The Stochastic Oscillators have crossed southbound, reaching the 56.28 and 28.12 ranges. And they are still pointing to the downside to indicate a selling order is somewhat ongoing.
Will the LTC/USD market go depressively at a high rate below the SMA trend lines soon afterward?
Although, it is apparent the LTC/USD market price loses momentum below the $70 resistance level. But, the crypto trade tends not to go digressively at a high rate below the trend lines of the SMAs in the near time. The trading situation is on the verge of setting a new pattern at a lower zone with less-active forces that cause dicey buying entries while a higher time frame uses. Insight out of that assumption suggests that lower time frames such as 4 hours and 1-hour will technically be ideal to decide on a safer entry order.
On the downside of the technical analysis, sellers of the LTC/USD market need to heighten their forces on the current movement to the downside. A sudden rebounding motion from the downward move will possibly break out the $65 resistance zone of the 50-day SMA to allow the market to settle for new higher-trading resistance zones in the long-term run. Therefore, short-position placers need to be wary of that presumed scenario if it has to materialize.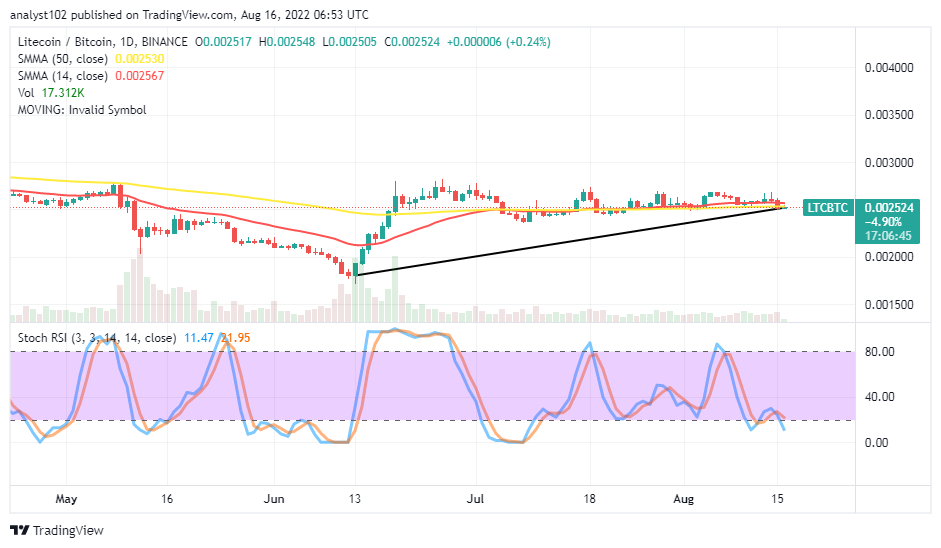
LTC/BTC Price Analysis
Litecoin has been holding positions against Bitcoin at a higher trading spot as it features some degrees of higher lows around the conjoined trend lines of the SMAs over a couple of sessions. The 14-day SMA indicator is tightly placed over the 50-day SMA indicator at the end as they both point toward the east direction. The bullish trend line drew northward below the SMAs to denote the deep lower point from where the pairing instrument has sprung to the higher spot. The Stochastic Oscillators are positioned at 21.95 and 11.47 range points to signify the base crypto is nearing an oversold condition against its counter-trading crypto.
Note: Cryptosignals.org is not a financial advisor. Do your research before investing your funds in any financial asset or presented product or event. We are not responsible for your investing results.
You can purchase Lucky Block here. Buy LBLOCK