Tamadoge (TAMA/USD) Breaks Above $0.0008 Resistance Level
Estimated Reading Time: 2 minutes
Don’t invest unless you’re prepared to lose all the money you invest. This is a high-risk investment and you are unlikely to be protected if something goes wrong. Take 2 minutes to learn more
The Tamadoge market established a solid bullish foundation at the $0.0006 level before encountering resistance at $0.0008. This resistance initially created a phase of indecision, as the market had only recently secured support at the same price point. However, bullish pressure persisted, and buyers ultimately broke through the $0.0008 barrier. The breakout has sparked renewed optimism, with market sentiment now pointing toward a potential rally toward the $0.001 mark.
Key Levels to Watch
- Resistance Zones: $0.00045, $0.00050, $0.00055
- Support Zones: $0.00006, $0.00005, $0.00004
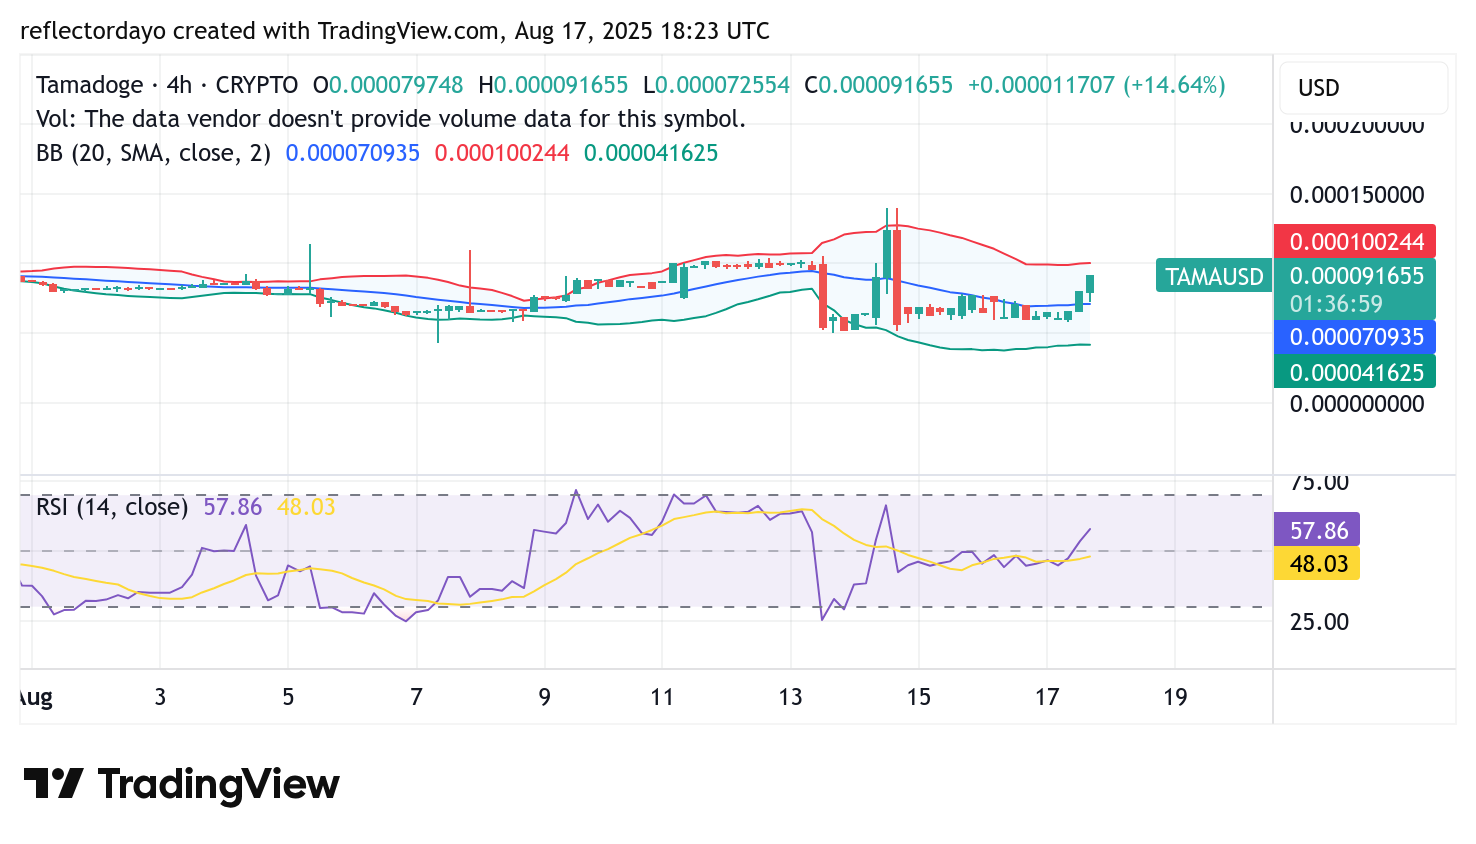
Tamadoge (TAMA/USD) 4-Hour Chart: $0.0008 Resistance Flips to Support
The breakout above the $0.0008 level has strengthened bullish momentum, pushing the crypto signal further upward. Previously, this zone acted as a significant resistance, causing Tamadoge traders to monitor closely for direction. Once the market moved decisively higher, additional buyers entered, amplifying the bullish run. Based on the current price action, the $0.0008 level has now transitioned from resistance to support, creating a solid foundation for continued upward movement.
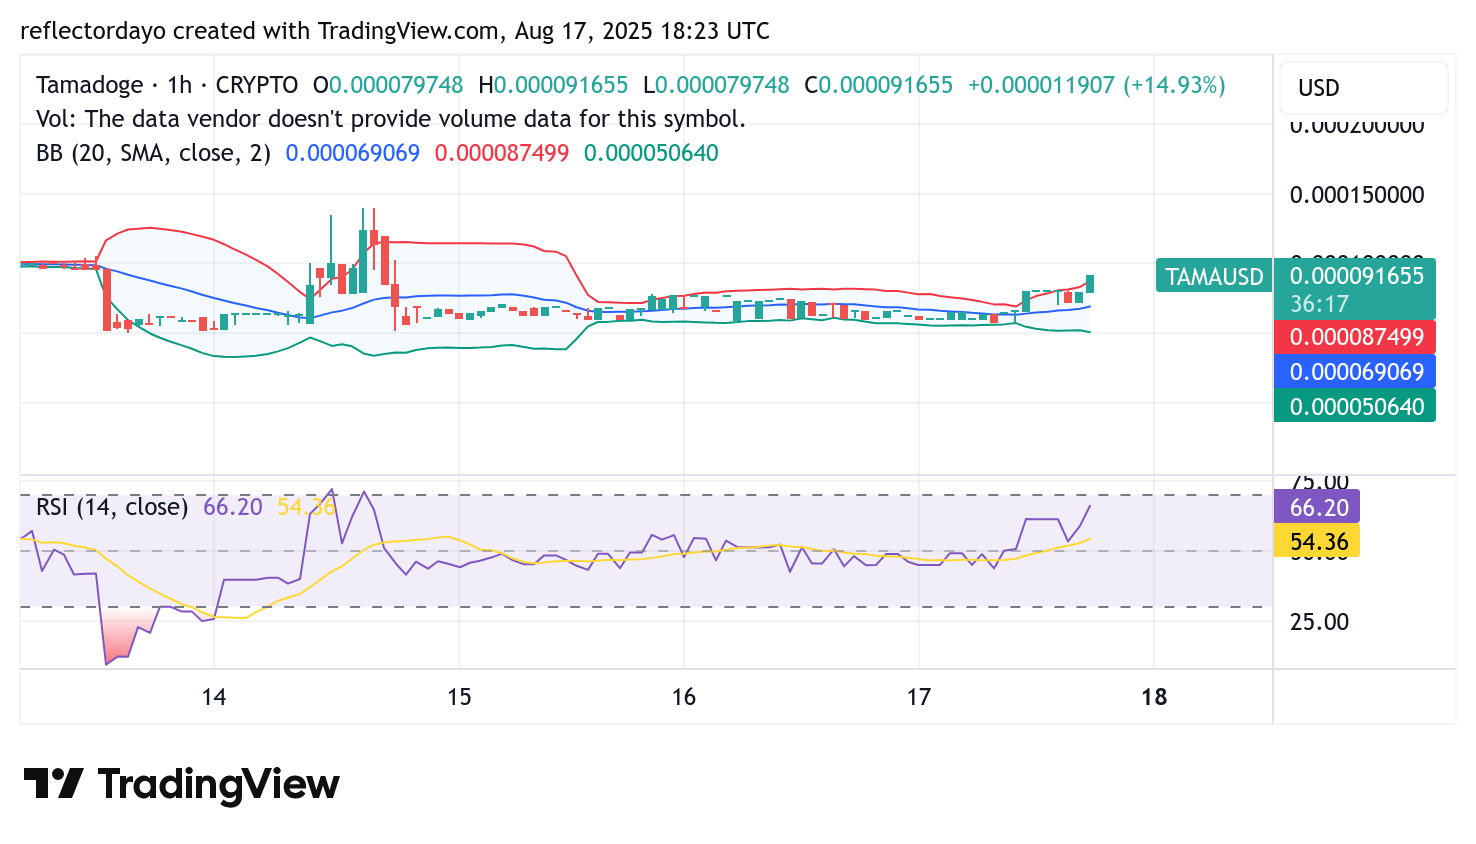
Tamadoge (TAMA/USD) 1-Hour Chart: Key Test at $0.001 Resistance
The immediate hurdle for Tamadoge lies at the $0.001 resistance level. A decisive breakout here could open the path for bulls to retest the previous high at $0.0014. However, the Bollinger Bands are currently widening, signaling increased volatility and the potential for a significant challenge at the $0.001 mark. Traders will be watching closely to see if buying momentum is strong enough to sustain the next leg upward.
Buy TAMA/USD!
There’s no mobile runner out there quite like #TamadogePursuit! 🏃♂️
1️⃣ Sign up – start with 20 free credits for a boost!
2️⃣ Climb up the leaderboards.
3️⃣ Win $TAMA rewards!Play Now! 👇
📱Android: https://t.co/Of8SYALRzL
📱 iOS: https://t.co/IthvqovwAH pic.twitter.com/84HNqob9Rf— TAMADOGE (@Tamadogecoin) September 10, 2024