Dogecoin (DOGE/USD) Price Has Lost Value to Arrive at $0.080
Estimated Reading Time: 3 minutes
Don’t invest unless you’re prepared to lose all the money you invest. This is a high-risk investment and you are unlikely to be protected if something goes wrong. Take 2 minutes to learn more
Dogecoin Price Prediction – April 24
It obtained that the DOGE/USD price has lost value to arrive around the trading spot of $0.080, envisaging to come with the creation of a formidable baseline soon. Between $0.0802 and $0.0780, the trade price is at $0.0784, sustaining a minute negative percentage rate of 0.25. Pushing lower than the value in the headline could not have the vitality necessary for sustenance.
DOGE/USD Market
Key Levels:
Resistance levels: $0.90, $0.10, $0.11
Support levels: $0.075, $0.070, $0.065
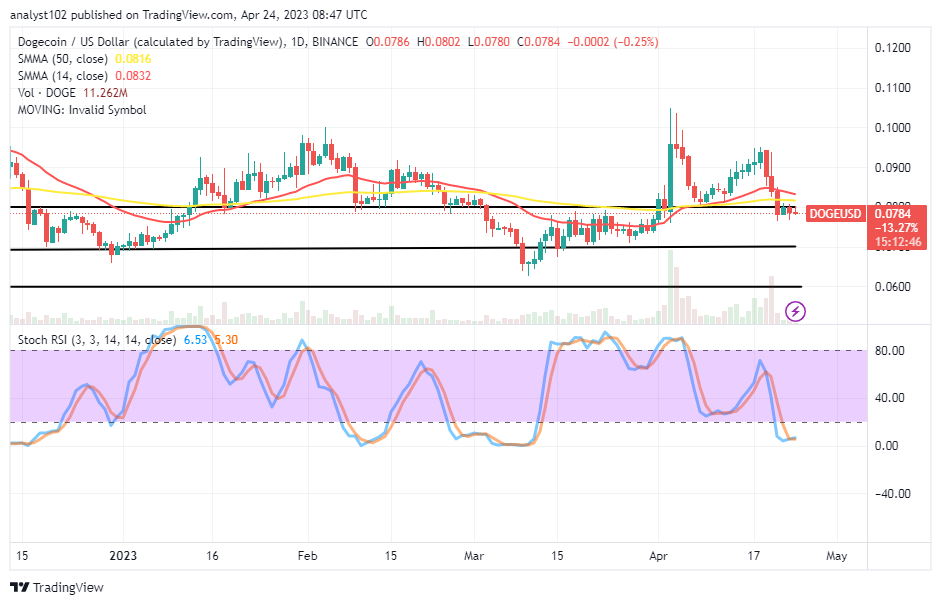
DOGE/USD – Daily Chart
Today’s DOGE/USD daily chart showcases the crypto-economic price has lost value to arrive around the $0.080 support spot where an upper-range trading condition had played out some time back. The Stochastic Oscillators are in the oversold region, keeping 5.30 and 6.53 points faintly possessing a tinier upward sign. Both trading indicators are slightly over the value line, with the 14-day SMA trend line at $0.0832 and the 50-day SMA trend line at $0.0816.
What could be the maximal low point the DOGE/USD trade could reduce from its current trading axis?
For the DOGE/USD market to push maximally further to the downside from its present point, it would require the price to dwell so long in a consolidation-moving manner as the price has lost value from a high spot of around $0.095 to arrive at the $0.080 line. Buyers should be aware of an eventual occurrence in which the 14-day SMA to the southside intercepts the 50-day SMA since it could indicate the moments of a succession of lows that do not provide healthy shorting entry.
On the downside of the technical analysis, in the wake of the result of the southward crossing between the SMAs, shorting entries have been placed against the buying signal of the 14-day SMA trend line may allow to play along until a bullish trading candlestick emerges to decimate the velocity path to the down. That being said, a candlestick formed during the 22nd session of this month has impacted the knowledge that if bears do not release more power to hold firmly, the market will soon rebound upward.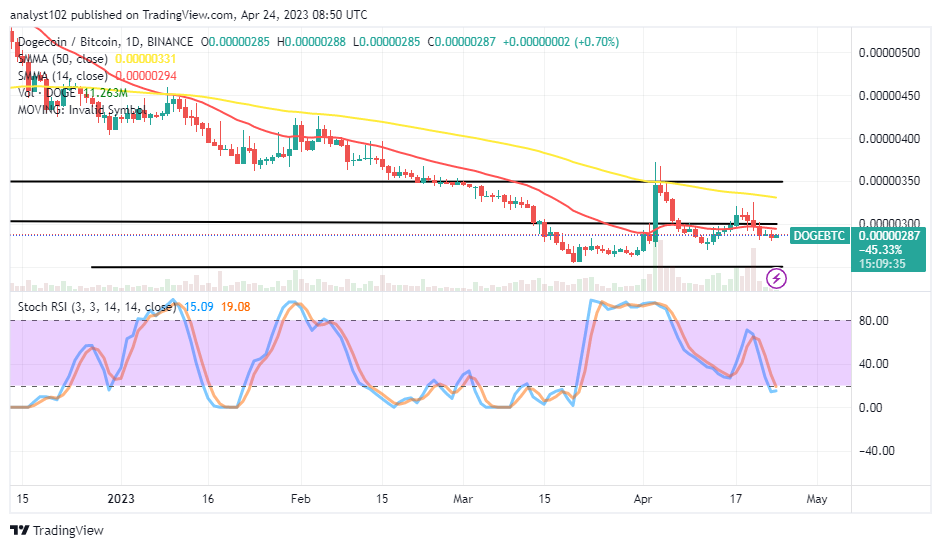
DOGE/BTC Price Analysis
In comparison, Dogecocoin is in an outlook that showcases that it lost value against Bitcoin, arriving tightly beneath the trend line of the smaller SMA. The 50-day SMA indicator is above the 14-day SMA indicator. The present trading situation shows the pairing crypto’s valuation is above the lower-range baseline. The stochastic oscillators are crossing southward and appear to be trying to close at levels 19.08 and 15.09. Buyers should reintroduce some of their cash while avoiding excessive leverage in their trade strategy.
Note: Cryptosignals.org is not a financial advisor. Do your research before investing your funds in any financial asset or presented product or event. We are not responsible for your investing results.
You can purchase Lucky Block here. Buy LBLOCK