Dogecoin (DOGE/USD) Trade Is Succumbing to a Decline Force Leftover
Estimated Reading Time: 3 minutes
Don’t invest unless you’re prepared to lose all the money you invest. This is a high-risk investment and you are unlikely to be protected if something goes wrong. Take 2 minutes to learn more
Dogecoin Price Prediction – April 10
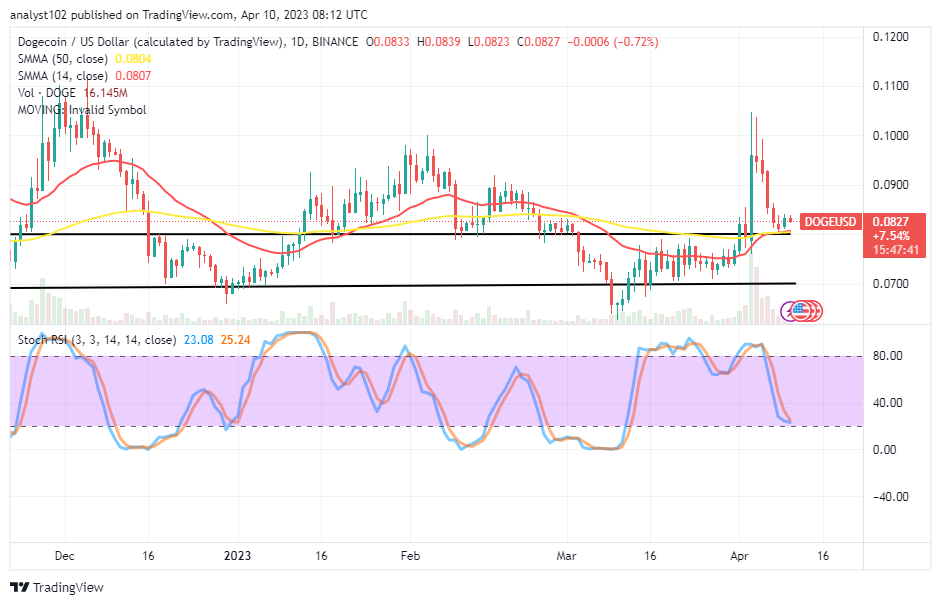
About eight days back, the DOGE/USD price rose briefly over the resistance line of $0.10, which eventually weakened in the process that made the crypto-economic trades succumb to a declining force leftover following a correction that dominated the pace. As of this technical write-up, the transactions line is at $0.0827 at a minute negative percentage rate of 0.72. The trading capacity’s perspective suggests the falling step will soon end, which could serve as a baseline shortly.
DOGE/USD Market
Key Levels:
Resistance levels: $0.090, $0.095, $0.1
Support levels: $0.075, $0.070, $0.065
DOGE/USD – Daily Chart
Today’s DOGE/USD daily chart has mirrored the crypto trade is succumbing to a declining force leftover close to the previous upper range point at $0.080. The 14-day SMA indicator is at $0.0807, faintly above the $0.0804 value line of the 50-day SMA indicator. The Stochastic Oscillators have transversed southbound to 25.24 and 23.08 levels to showcase the velocity rate the price has reached to the downside. A smaller bullish candlestick emerged yesterday to sound a notice of warning against panic sell-offs.
Can the DOGE/USD market bears push further into their previous range-bound points of $0.080 and $0.070?
The price may quickly recoup its rallying energy if a rapid southbound push occurs in the DOGE/USD market operations into the previous range-bound places because it has been that the crypto trade is only giving in to a decreasing force leftover. Even if there is room for further lows in the near term, investors may now have a purchasing window opportunity to add more money to their portfolios.
On the downside of the technical analysis, at the moment, less gravitational power to back a further devaluation movement beyond the points of the SMAs has been losing value. Therefore, it is not that ideally psychological to trade alongside any attempted drop that can surface around those points to escape through the possibility of getting trapped in the process in no time. Once more, getting into a cycle of shorting spree will take some time.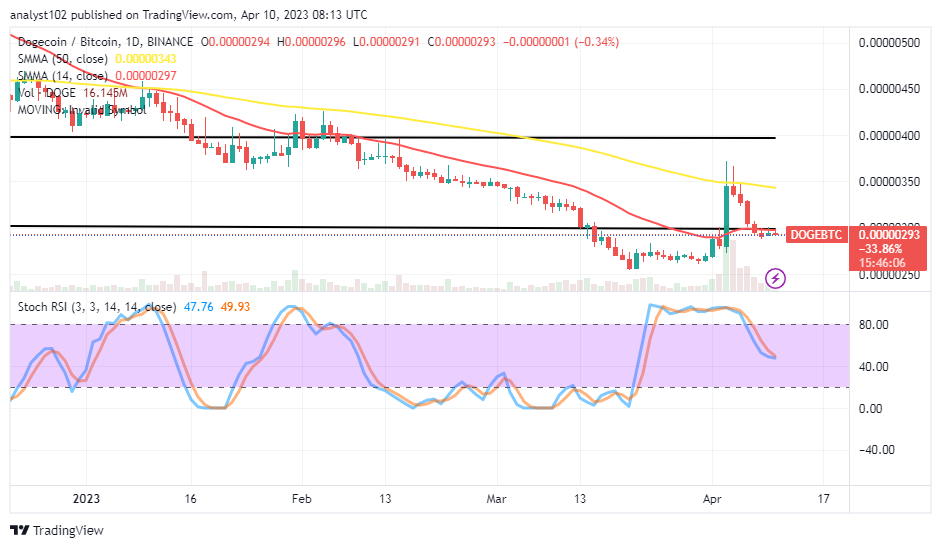
DOGE/BTC Price Analysis
In comparison, Dogecocoin has been able to spike northward against the trending ability of Bitcoin from a long-overbought-trading outlook condition recently. The pairing crypto trade is currently succumbing to a declining force leftover that trailed the hiking, making the price tightly underneath the trend line of the smaller SMA. The 50-day SMA indicator is above the 14-day SMA indicator. The stochastic Oscillators are at 49.93 and 47.76 levels, trying to close their lines. And that might mean that trading between the two cryptocurrencies may pause for a spell.
Note: Cryptosignals.org is not a financial advisor. Do your research before investing your funds in any financial asset or presented product or event. We are not responsible for your investing results.
You can purchase Lucky Block here. Buy LBLOCK