Immutable X (IMX) Bull Market Is Seeing a Sudden Surge in the Level of Investor Interest
Estimated Reading Time: 3 minutes
Don’t invest unless you’re prepared to lose all the money you invest. This is a high-risk investment and you are unlikely to be protected if something goes wrong. Take 2 minutes to learn more
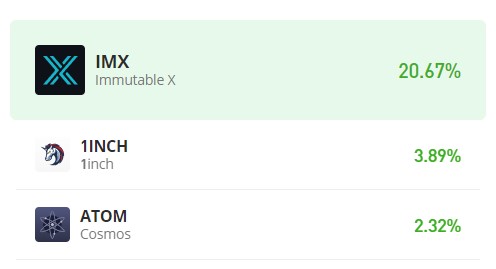
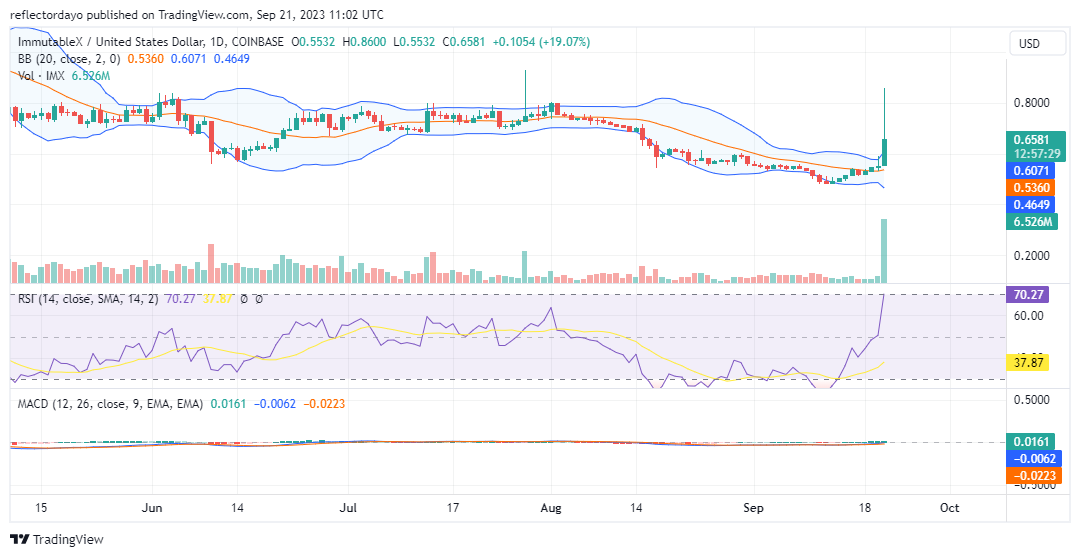
On September 13, Immutable X experienced a notable cessation of its downtrend at the $0.500 price threshold. This development holds substantial significance as it signifies the potential initiation of a trend reversal, transitioning from a bearish to a bullish sentiment. Initially, the price rally displayed a gradual ascent, reflecting limited liquidity in both the bullish and bearish markets. But today’s market conditions are characterized by a significant surge in bullish sentiment.
IMX Market Data
- IMX/USD Price Now: $0.67
- IMX/USD Market Cap: $779,786,923
- IMX/USD Circulating Supply: 1,169,899,199 IMX
- IMX/USD Total Supply: 2,000,000,000 IMX
- IMX/USD CoinMarketCap Ranking: #45
Key Levels
- Resistance: $0.70, $0.75, and $0.80.
- Support: $0.60, $0.55, and $0.50.
Price Prediction for Immutable X: The Indicators’ Point of View
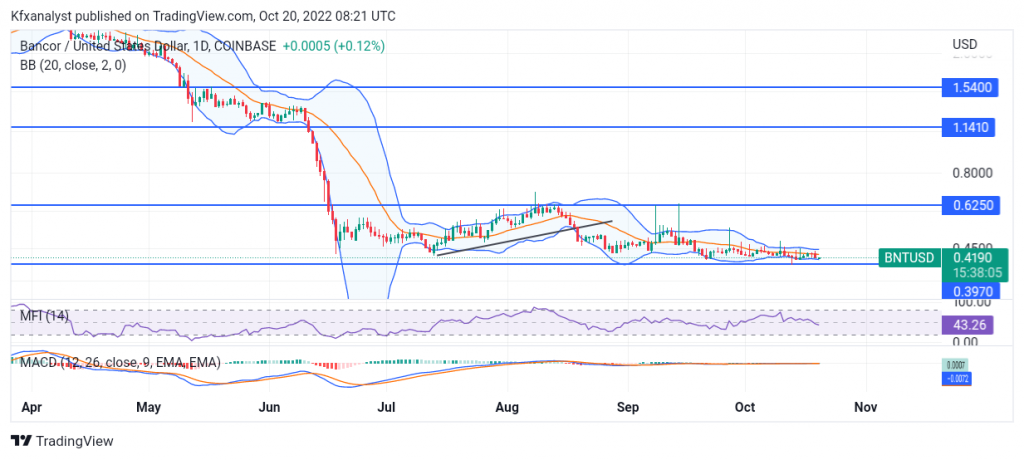
While the Immutable X market has transitioned from a downtrend to an uptrend since September 13, the price channel, as depicted by the Bollinger Bands indicator, has not definitively shifted towards an upward trajectory. This may be attributed to the fact that the price recovery has been gradual yet steady.
However, today’s market has experienced a sudden and substantial influx of buying pressure, leading to a pronounced expansion of the Bollinger Bands. The widening gap between the two standard deviations underscores the heightened volatility within the market. This elevated volatility level also warrants caution, as it empowers bearish forces, potentially paving the way for a significant price correction. Traders may view this as an opportunity to realize substantial profits.
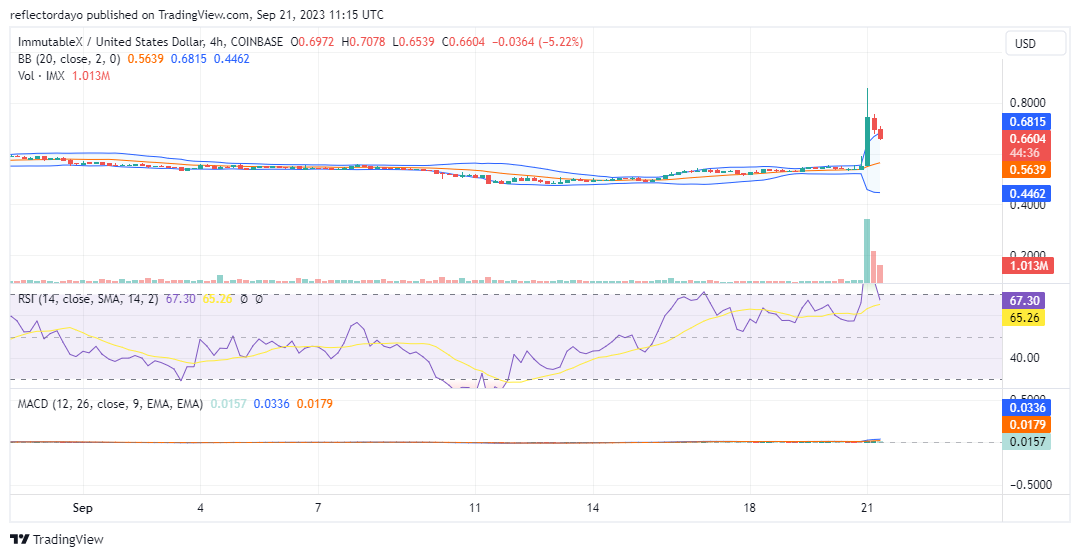
IMX/USD 4-Hour Chart Outlook
As profit-taking persists, the bull market is in need of a robust support level. When examining the Immutable X market through the lens of the Relative Strength Index (RSI), it becomes evident that bearish sentiment may still have room to influence the market. Profit-taking activities remain ongoing. This observation is rooted in the fact that despite a retracement from recent highs in the overbought territory, the price still hovers around the overbought region, specifically at 66.7. To sustain the bull market’s momentum, it would be prudent for the bulls to establish a support level above the 20-day moving average.