Orchid (OXT/USD) Bulls Salvage the Market at a Higher Support Level
Estimated Reading Time: 3 minutes
Don’t invest unless you’re prepared to lose all the money you invest. This is a high-risk investment and you are unlikely to be protected if something goes wrong. Take 2 minutes to learn more
After the Orchid hyperbullish phase observed in mid-September, as anticipated, a substantial bearish market ensued. This occurred subsequent to a surge in investor interest that propelled the market to reach a peak of $0.086. Nonetheless, the bulls have successfully managed to reverse the bearish trend at a higher pivotal price level. This recent market development, occurring at this elevated support level, is expected to sustain the bullish momentum in the market.
Orchid Market Data
- OXT/USD Price Now: $0.0690
- OXT/USD Market Cap: $66,288,868
- OXT/USD Circulating Supply: 962,629,339 OXT
- OXT/USD Total Supply: 1,000,000,000 OXT
- OXT/USD CoinMarketCap Ranking: #301
Key Levels
- Resistance: $0.075, $0.08, and $0.085.
- Support: $0.05, $0.045, and $0.040.
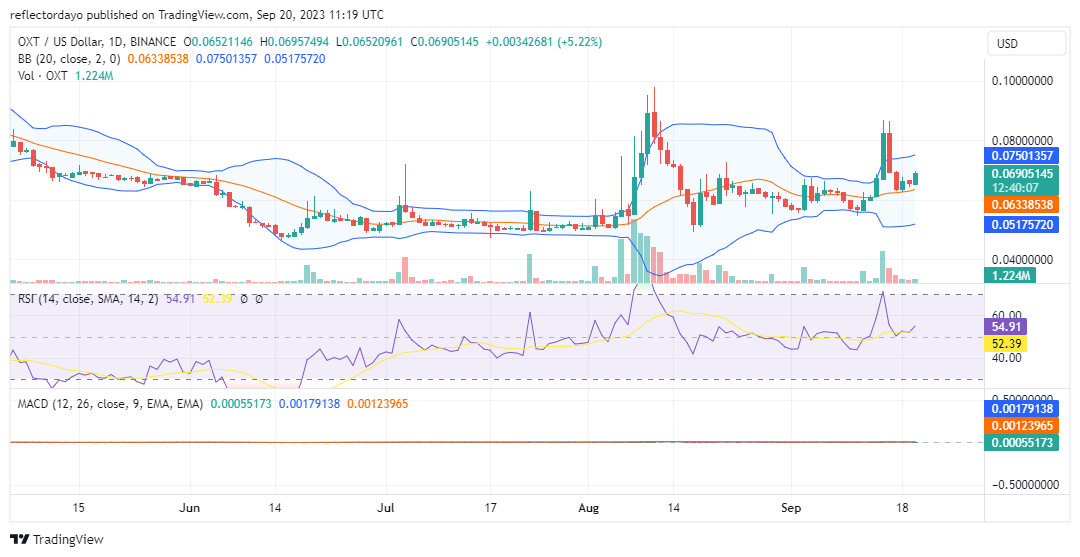
Price Prediction for Orchid: The Indicators’ Point of View
The Orchid price correction has been adeptly managed by the bulls, successfully reversing the market’s course at a higher support level, which also resides above the 20-day moving average. As a result, the widening Bollinger Bands are indicating the formation of an upward-moving price channel, suggesting that the buyers could still maintain their position in the market.
However, a concern arises when we compare the last two highs: the $0.087 peak and the $0.098 peak, revealing a descending pattern. When combined with the presence of higher lows, it suggests the possibility of a consolidation phase in the market before a definitive direction emerges.
Additionally, a potential indicator of weakening bullish momentum is the formation of low histograms, which represent reduced trading volumes. This diminishing activity could signify a waning bullish presence in preparation for an impending consolidation period.
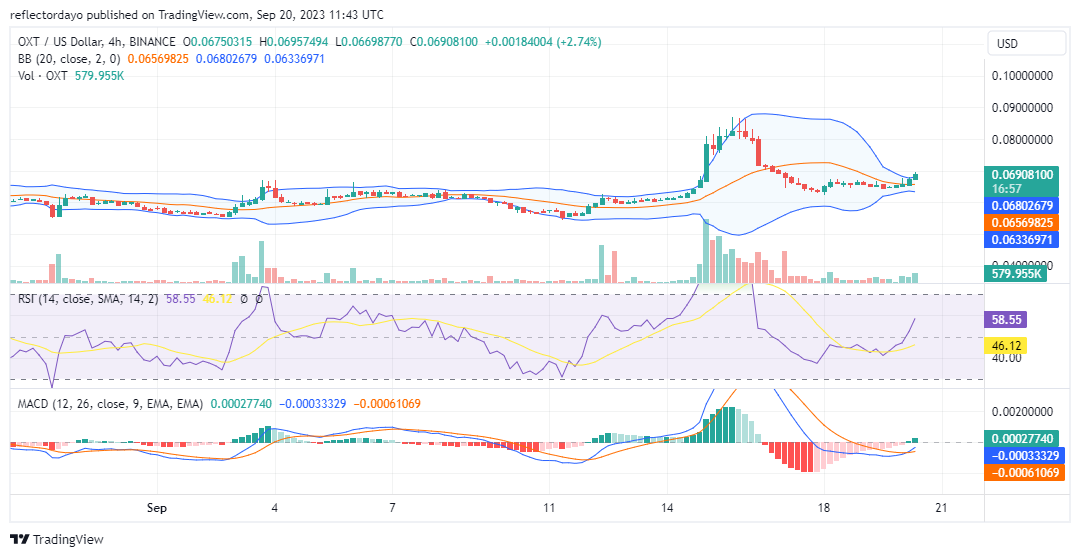
OXT/USD 4-Hour Chart Outlook
From a shorter timeframe perspective, it appears that the bulls remain prominently active, signaling a potential continuation of the uptrend. The Bollinger Bands indicator reflects a brief period of volatility compression. At present, buying pressure appears to be catalyzing yet another breakout, causing the Bollinger Bands to expand once more. This expansion is indicative of heightened liquidity within the bullish market, thereby influencing the volatility dynamics of the Orchid market.