Polkadot Faces Stiff Rejection at $6.50 as It Re-Intensifies Its Decline
Estimated Reading Time: 2 minutes
Don’t invest unless you’re prepared to lose all the money you invest. This is a high-risk investment and you are unlikely to be protected if something goes wrong. Take 2 minutes to learn more
Polkadot (DOT) Long-Term Analysis: Bearish
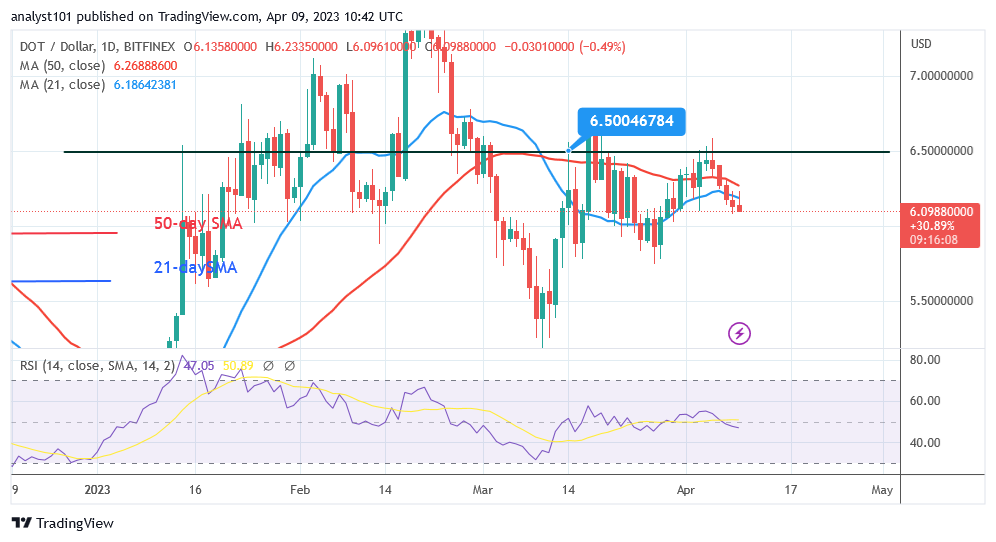
The price of Polkadot (DOT) is decreasing as it re-intensifies its decline. Price is probably going to keep falling below moving average lines. During the previous price action, buyers failed twice to break through the resistance at $6.50. The cryptocurrency would have reached a high of $8.00. The failure of buyers is the cause of the current decline. DOT/USD will test the downside low of $5.50 if the selling pressure persists. On the other hand, Polkadot has decreased over a shorter period to the oversold area. This may indicate that the selling pressure has reached its bearish limit. Prices are unlikely to decrease any further than the earlier $5.50 low.
Polkadot (DOT) Indicator Analysis
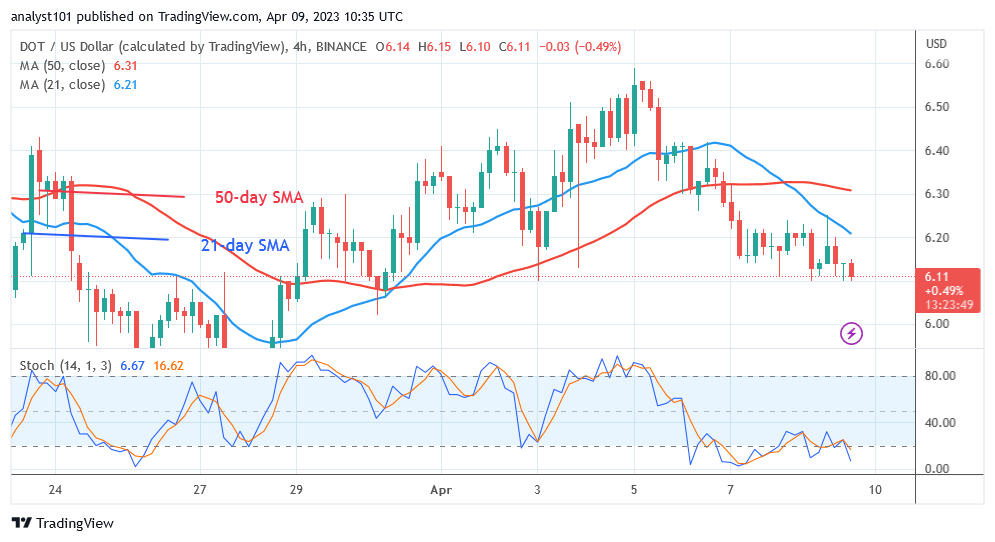
On the Relative Strength Index for period 14, Polkadot is at level 47. The cryptocurrency asset is currently trading in the bearish trend zone, which causes further decline. Further decline is possible because the price bars are below the moving average lines. Polkdot is currently below the daily Stochastic level of 20. It’s a sign that the market has been oversold. The bearish trend will soon come to an end.
Technical indicators:
Major Resistance Levels – $10, $12, $14
Major Support Levels – $8, $6, $4
What Is the Next Direction for Polkadot (DOT)?
The Polkadot pattern has declined in popularity since April 5th as it re-intensifies its decline. The market’s oversold area has been reached by the decline. The market will increase if buyers appear in the oversold area. A strong downward trend in the DOT price is indicated by price bars that are below moving average lines.
You can purchase Lucky Block here. Buy LBLOCK
Note: Cryptosignals.org is not a 1a financial advisor. Do your research before investing your funds in any financial asset or presented product or event. We are not responsible for your investing results