Polkadot Is in a Positive Trend as It Revisits the $6.50 High
Estimated Reading Time: 2 minutes
Don’t invest unless you’re prepared to lose all the money you invest. This is a high-risk investment and you are unlikely to be protected if something goes wrong. Take 2 minutes to learn more
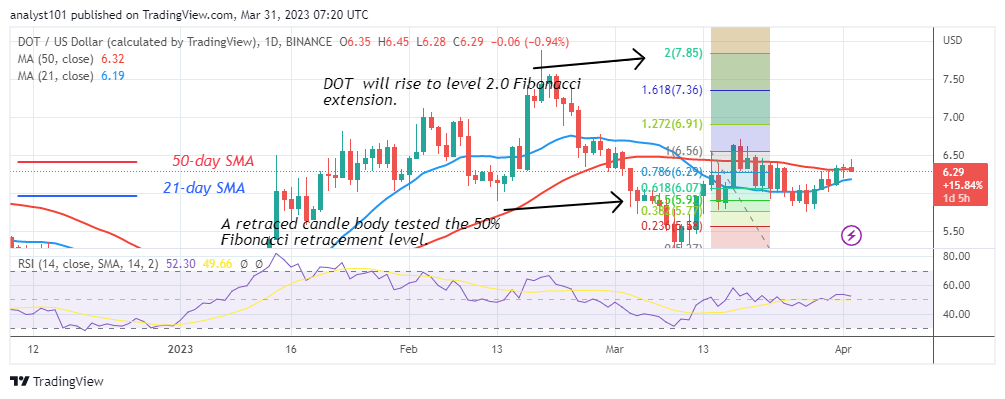
Polkadot (DOT) Long-Term Analysis: Bullish
Polkadot (DOT) price is constrained by moving average lines as it revisits the $6.50 high. The rising movement has twice been halted as it tries to overcome the $6.50 resistance level and the 50-day SMA. At the time of writing, the cryptocurrency asset is trading for $6.21. Polkadot will be compelled to move range-bound between the moving average lines if it is captured. Yet the altcoin will trend if the moving average lines are crossed. The DOT price will rise as long as purchasers keep the price over the $6.50 barrier or the 50-day SMA. The market will decline negatively if the bears break below the 21-day SMA. The cost will consequently once more decrease to $5.50.
Polkadot (DOT) Indicator Analysis
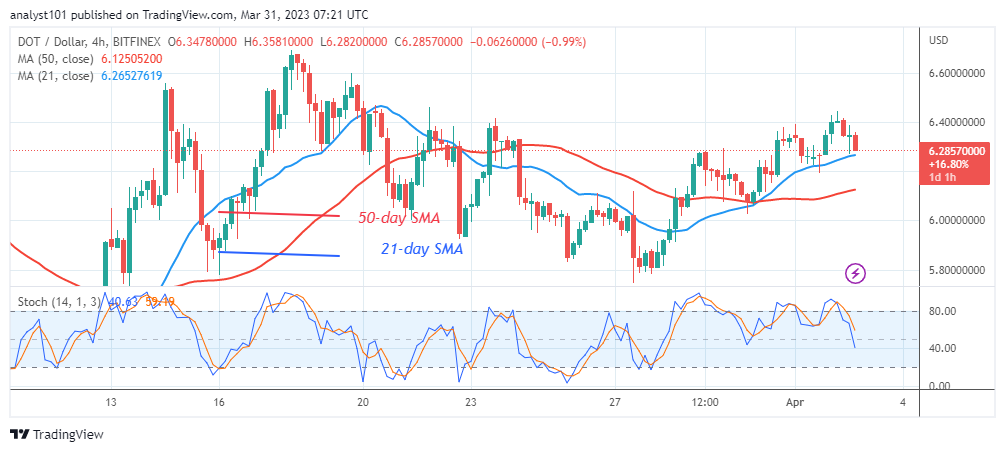
At level 51 of the Relative Strength Index for period 14, Polkadot is in decline. The demand and supply for the cryptocurrency asset have reached equilibrium. A range-bound move might be necessary because the coin is now situated between the moving average lines. The coin is going bearishly as it approaches the oversold region. Currently, the daily Stochastic is below level 20.
Technical indicators:
Major Resistance Levels – $10, $12, $14
Major Support Levels – $8, $6, $4
What Is the Next Direction for Polkadot (DOT)?
Polkadot has re-established itself after a recent lull as it revisits the $6.50 high. The altcoin plummeted to the oversold region on the 4-hour chart but is presently trapped between the moving average lines. The oversold region saw buyers emerge, and the coin’s trend has since changed back to positive.
You can purchase Lucky Block here. Buy LBLOCK
Note: Cryptosignals.org is not a 1a financial advisor. Do your research before investing your funds in any financial asset or presented product or event. We are not responsible for your investing results