Polkadot Recovers but Battles the Resistance at $6.10
Estimated Reading Time: 2 minutes
Don’t invest unless you’re prepared to lose all the money you invest. This is a high-risk investment and you are unlikely to be protected if something goes wrong. Take 2 minutes to learn more
Polkadot (DOT) Long-Term Analysis: Bearish
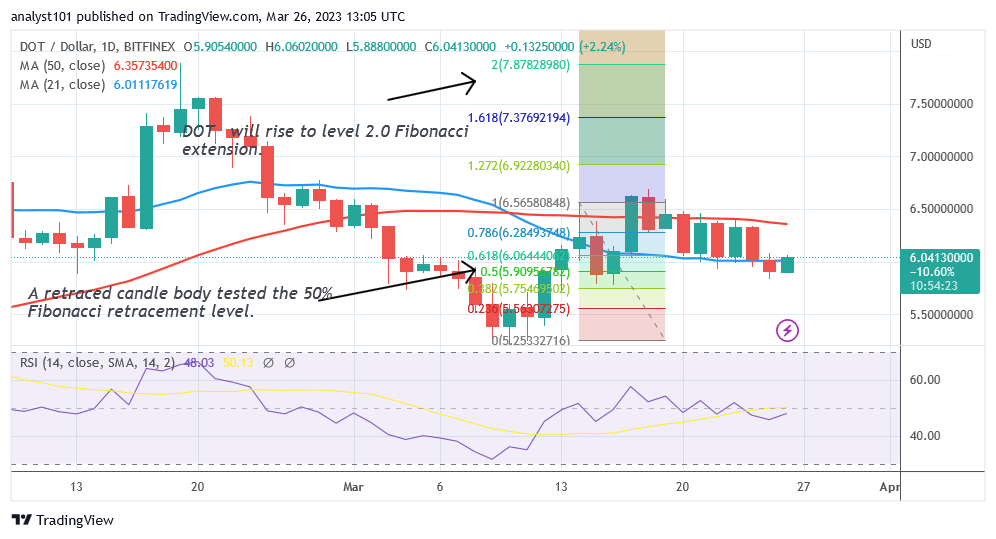
The price of Polkadot (DOT) has crossed over the 21-day moving average line but battles the resistance at $6.10. The altcoin is now trading at $6.07 at the time of writing. The DOT price is above the 21-day SMA even though it is below the 50-day SMA. It is projected that the $6.50 high of the 50-day SMA would act as a barrier for the upward trend. But, if the $6.50 barrier is crossed, the DOT price will rise to a maximum of $7.50. On the other hand, Polkadot will probably be driven into a range-bound move between the moving average lines where the 50-day SMA is still intact.
Polkadot (DOT) Indicator Analysis
Polkadot is currently trading at level 48, as indicated by the Relative Strength Index for period 14 o. After a recent dip, the altcoin is now in a bearish trend zone. With the recent price recovery, the price bar is now above the 21-day moving average line. The coin is most likely trapped between the moving average lines.
Technical indicators:
Major Resistance Levels – $10, $12, $14
Major Support Levels – $8, $6, $4
What Is the Next Direction for Polkadot (DOT)?
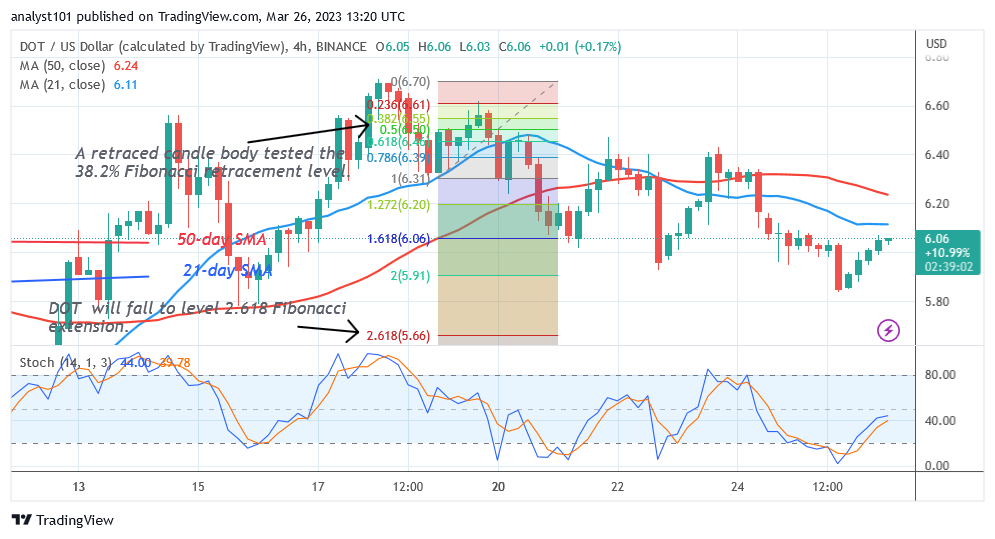
Polkadot has recovered after reaching the oversold region of the market but battles the resistance at $6.10. The bulls bought the dips once the price dropped to $5.84. The price indicator had forecasted a low of $5.66 before this fall. Today, the market rose to a high of $6.08.
You can purchase Lucky Block here. Buy LBLOCK
Note: Cryptosignals.org is not a 1a financial advisor. Do your research before investing your funds in any financial asset or presented product or event. We are not responsible for your investing results