Polkadot Is on the Rise as It Targets the $7.93 High
Estimated Reading Time: 2 minutes
Don’t invest unless you’re prepared to lose all the money you invest. This is a high-risk investment and you are unlikely to be protected if something goes wrong. Take 2 minutes to learn more
Polkadot (DOT) Long-Term Analysis: Bearish
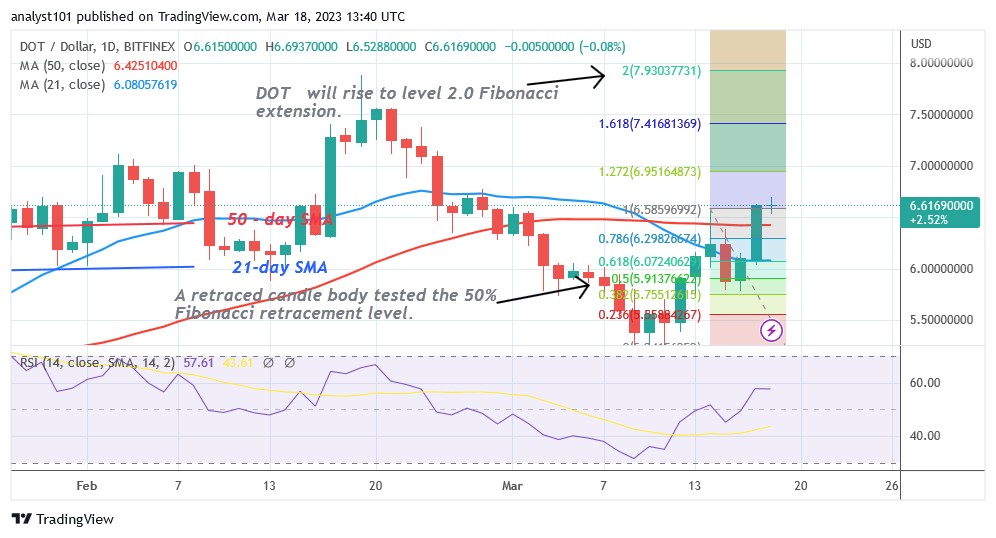
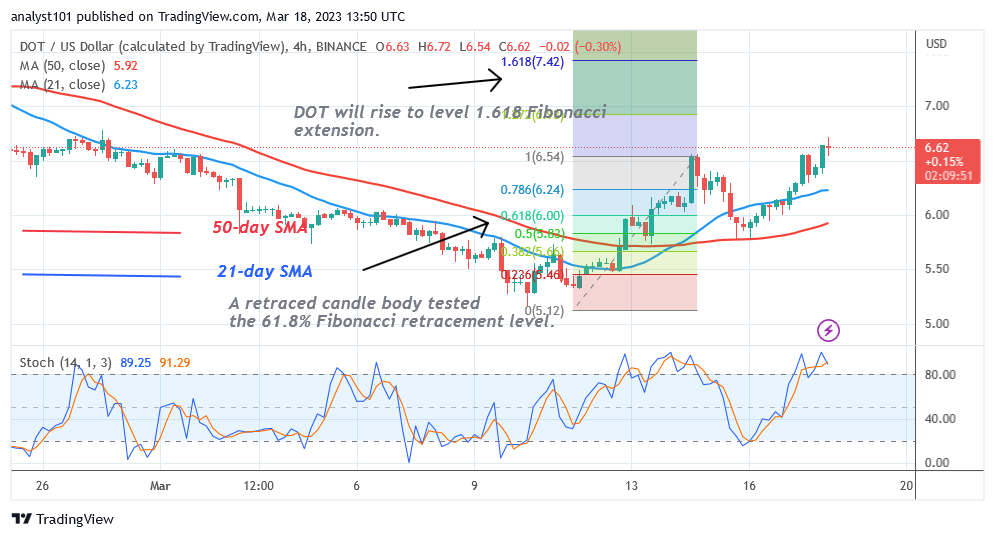
The price of Polkadot (DOT) has broken above the moving average lines as it targets the $7.93 high. At $6.59, the altcoin is trading above the moving average lines. The cryptocurrency asset is currently trading in an overbought area as it faces rejection. On March 14, buyers were unable to sustain the price above the $6.56 resistance level, and the altcoin fell below the $6.00 support. The same resilience is being tried once more right now. A retraced candle body on the upswing of March 14 tested the 50% Fibonacci retracement level. According to the retracement, DOT will increase to level 2.0 of the Fibonacci extension, or $7.93. According to the price movement, DOT is currently trading at $6.62.
Polkadot (DOT) Indicator Analysis
The Relative Strength Index for period 14 shows Polkadot trading at level 58, which is in the positive trend zone. Another indication of a prospective rise is the fact that the price bars are higher than the moving average lines. Yet, level 80 of the daily Stochastic is higher than the DOT price. As a result of crossing the overbought area, the coin may now fall. However, in a strong trending market an overbought condition may not hold.
Technical indicators:
Major Resistance Levels – $10, $12, $14
Major Support Levels – $8, $6, $4
What Is the Next Direction for Polkadot (DOT)?
Polkadot is returning to earlier highs as it targets the $7.93 high. If the cryptocurrency breaks through the initial resistance level, it will continue to rise. The market will climb and reach a high of $8.00, according to the price indicator.
You can purchase Lucky Block here. Buy LBLOCK
Note: Cryptosignals.org is not a 1a financial advisor. Do your research before investing your funds in any financial asset or presented product or event. We are not responsible for your investing results