SPONGE/USD ($SPONGE): This Week Promises to Be Good for the Bulls
Estimated Reading Time: 2 minutes
Don’t invest unless you’re prepared to lose all the money you invest. This is a high-risk investment and you are unlikely to be protected if something goes wrong. Take 2 minutes to learn more
The selling pressure is forcing the SPONGE/USD pair more into the demand zone. However, the buyers continue to form a hindrance to the bearish advances, and because the market is now ranging sideways along the support level, an upward price breakout may be imminent. We may begin to see this play out as the new week unfolds.
Key Levels
- Resistance: $0.0004, $0.0045, and $0.0005.
- Support: $0.00012, $0.00011, and $0.00009.
Sponge (SPONGE/USD) Price Analysis: The Indicators’ Point of View
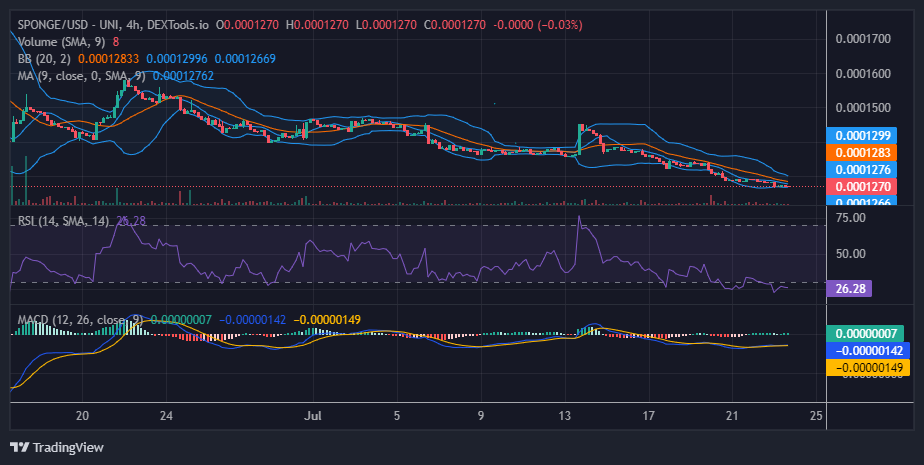
After the selling pressure forced the SPONGE/USD market below the $0.00013 price level, the Bollinger Bands’ portrayal of a downward trending market began to come clear. However, as the market ranged sideways along the new support level, the bands also began to converge against the price action. This could be a sign of a trend reversal.
Also, in the Relative Strength Index, the market is moving in the oversold region. This indication can spark bullish sentiment among traders as the new week unfolds.
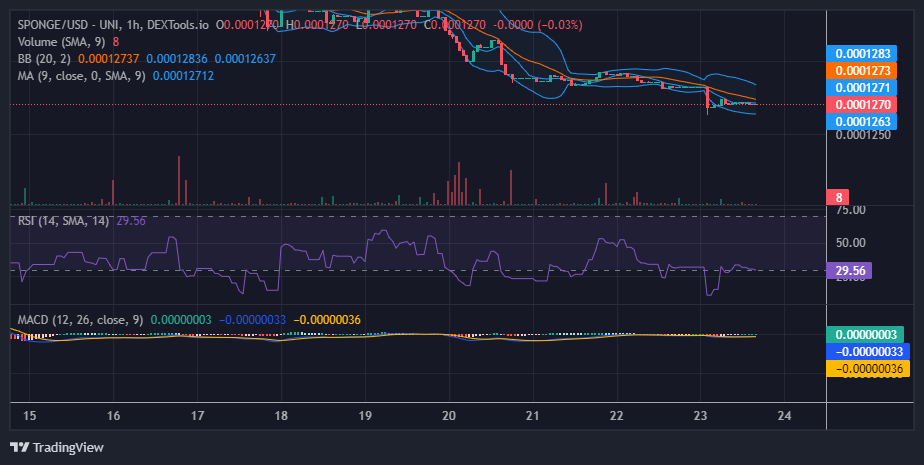
$SPONGE Short-Term Outlook: 1-Hour Chart
So far in today’s trading session, when considered from a 1-hour chart outlook, we have noticed a sharp recovery from oversold territory. However, the SPONGE/USD market continues to range along the edge of oversold territory. At this position in the market, the bulls have more chance than the bears to push the market in an upward direction.
Buy $SPONGE on LBANK Exchange.
🌊Hey #SPONGERS!👋🧽🌊
Dive into @LBank_Exchange and start trading $SPONGE to absorb all the damp!🚀💸
🔗https://t.co/wJrs7ud3mD pic.twitter.com/OU53cj2Zfo
— $SPONGE (@spongeoneth) July 23, 2023
Invest in the hottest and best meme coin. Buy Sponge ($SPONGE) today!