Polkadot Is in a Decline but Bounces above the $5.00 Support
Estimated Reading Time: 2 minutes
Don’t invest unless you’re prepared to lose all the money you invest. This is a high-risk investment and you are unlikely to be protected if something goes wrong. Take 2 minutes to learn more
Polkadot (DOT) Long-Term Analysis: Bearish
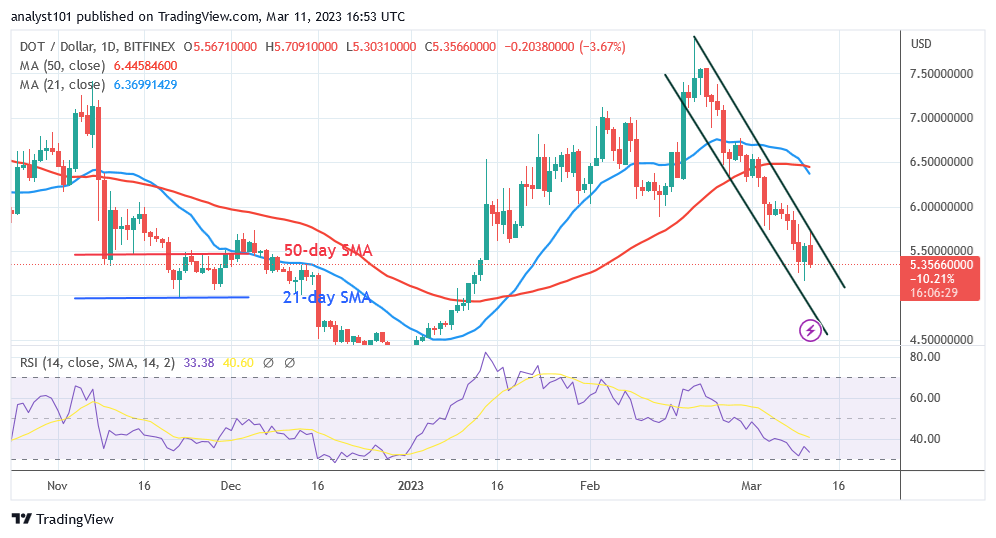
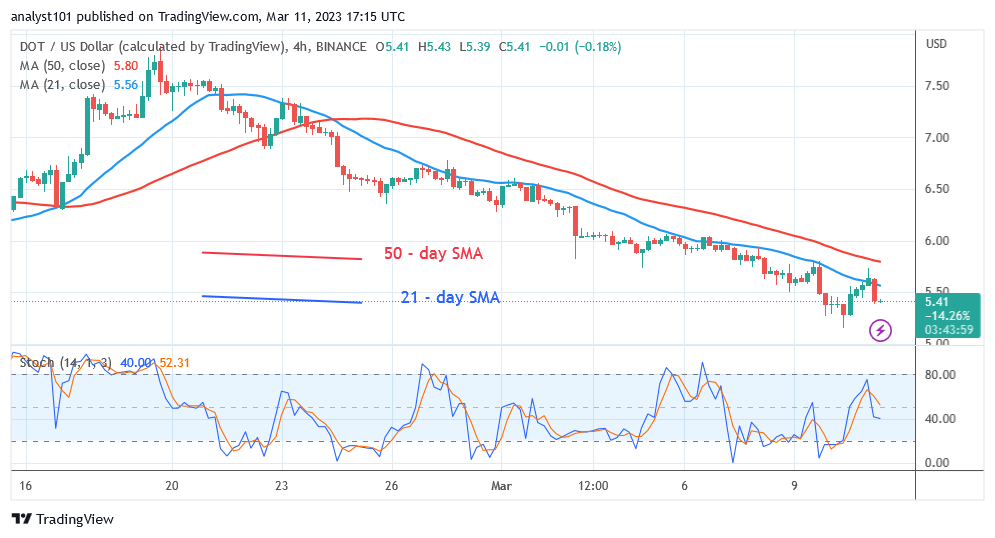
Polkadot (DOT) is now only $5.30, a record low as it bounces above the $5.00 support. The price of cryptocurrencies has crossed both the moving average line and the $6.00 support line. The altcoin is attempting to break through the $5.00 support once more despite its declining value. The price will resume its decline if it breaches the $5.00 support level. Polkadot’s cost will fall to a low of $4.25. The selling pressure will ease if the current support holds. The market’s upward movement will encounter resistance at the $6.00 high. The altcoin is currently testing the $5.00 support once more in an effort to overcome it.
Polkadot (DOT) Indicator Analysis
Polkadot is approaching the oversold region as it approaches level 34 of the Relative Strength Index for period 14. There is still room for further price reductions in DOT. The DOT price bars are below the moving average lines, which has caused the current decline. A bearish momentum is present for the altcoin below the daily Stochastic’s level 50.
Technical indicators:
Major Resistance Levels – $10, $12, $14
Major Support Levels – $8, $6, $4
What Is the Next Direction for Polkadot (DOT)?
Polkadot has seen a significant drop as it bounces above the $5.00 support. Currently, the altcoin is bouncing above the $5.00 support. The alternative currency will drop to its previous low at $4.25 if the current support is breached. The DOT price will resume its upward trend if it surpasses either the moving average lines or the resistance at $6.50..
You can purchase Lucky Block here. Buy LBLOCK
Note: Cryptosignals.org is not a 1a financial advisor. Do your research before investing your funds in any financial asset or presented product or event. We are not responsible for your investing results