Chainlink Recoups above $8.37 as It Reaches the High of $10.16
Estimated Reading Time: 2 minutes
Don’t invest unless you’re prepared to lose all the money you invest. This is a high-risk investment and you are unlikely to be protected if something goes wrong. Take 2 minutes to learn more

Free Crypto Signals Channel
Chainlink (LINK) Long-Term Analysis: Bullish
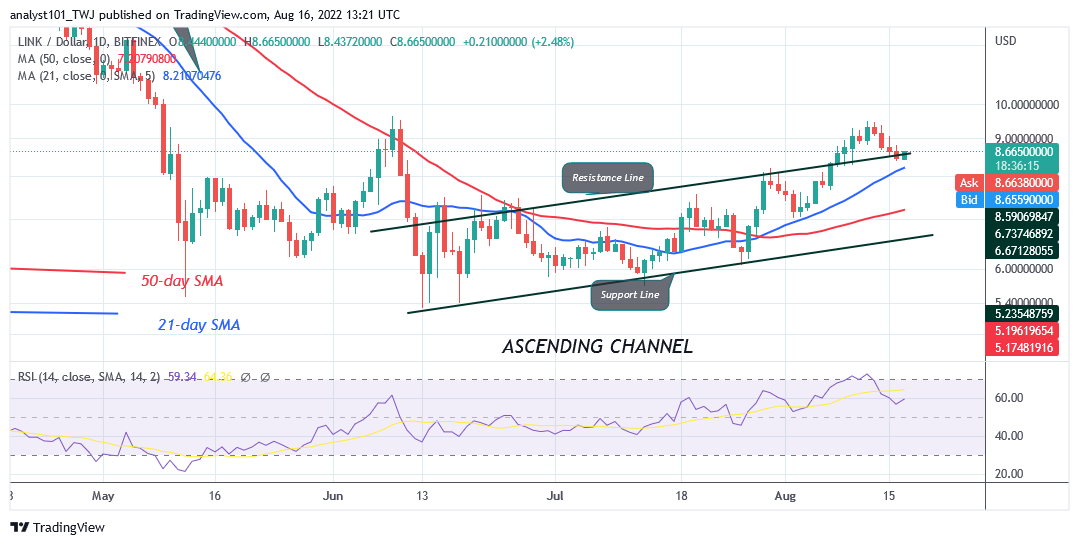
Chainlink’s (LINK) price rallied to the high of $9.50 as it reaches the high of $10.16. The crypto’s price retraced above the 21-day line and resumed upward. This is an implication of a further upward move of LINK prices. Since July 12, LINK’s price has been making higher highs and higher lows. The altcoin will rally above $10 if price breaks above the resistance at $9.50.However, Chainlink will decline if buyers fail to overcome the resistance at the recent high.
Chainlink (LINK) Indicator Analysis
The altcoin is at level 56 of the Relative Strength Index for period 14. LINK price is in the bullish trend zone despite the retracement. LINK’s price bars have retraced above the 21-day line SMA and the 50-day line SMA indicating a further upward movement of the coin. LINK is above the 60% area of the daily stochastic. The coin is in a bullish momentum. The 21-day line SMA and the 50-day line SMA are sloping upward indicating
the uptrend.
Technical indicators:
Major Resistance Levels – $18.00, $20.00, $22.00
Major Support Levels – $8.00, $6.00, $4.00
What Is the Next Direction for Chainlink (LINK)?
Chainlink has regained bullish momentum as it reaches the high of $10.16. Meanwhile, on July 30 uptrend, a retraced candle body tested the 50% Fibonacci retracement level. The retracement suggests that LINK will rise to level 2.0 Fibonacci extension or $10.16.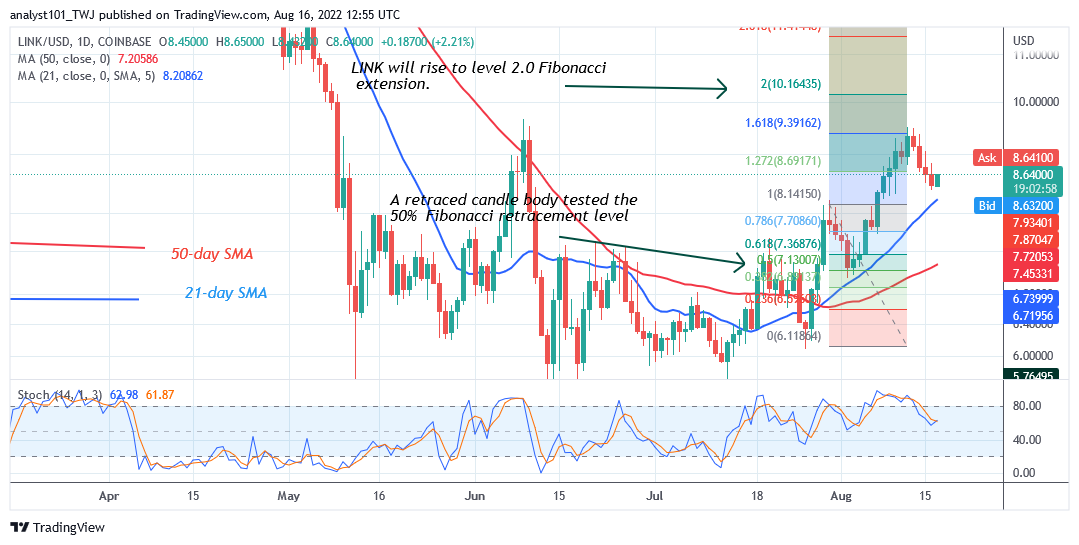
You can purchase crypto coins here. Buy LBLOCK
Note: Cryptosignals.org is not a financial advisor. Do your research before investing your funds in any financial asset or presented product or event. We are not responsible for your investing results