Polkadot (DOT/USDT) Sights Potential Breakout Amid Consolidation
Estimated Reading Time: 3 minutes
Don’t invest unless you’re prepared to lose all the money you invest. This is a high-risk investment and you are unlikely to be protected if something goes wrong. Take 2 minutes to learn more
The market for Polkadot against Tether has dropped 1.32%, adding to the 15.8% weekly decline as DOT/FDUSD Binance delisting and Bitcoin dominance amid technical breakdown effects.
As it stands, the market appears to be operating within a tight region as the Stochastic RSI points south as buying momentum continually drops.
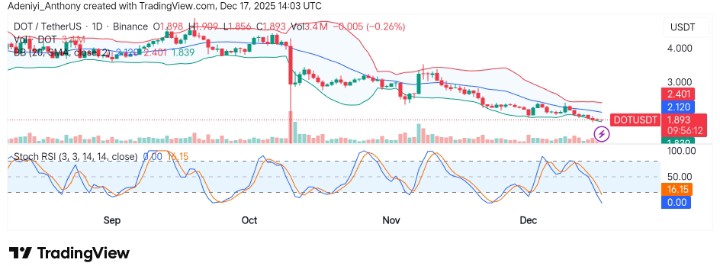
Currently, Polkadot trades at $1.890, with more than 3.9 million volumes on the daily chart.
Technical Indicators
Major Resistance Levels: $1.900, $2.120, and $2.400
Major Support Levels: $1.850, $1.800, and $1.750
Technical Analysis
On the chart, Polkadot against Tether is exhibiting a visible consolidation pattern within a stronger bearish structure, as the price operates near the lower Bollinger Band. Meanwhile, the Stochastic RSI appears to be in an oversold region, suggesting the pair might experience a bounce in the near term.
However, much bullish effort is needed to validate a bullish reversal, as a breakout beneath $2.12 signifies a minor bounce. To this end, the decreasing volume suggests that the current downtrend is losing momentum, which could provide a setup for a breakout if the market turns favorable.
Polkadot Technical Update
Polkadot trading for quite a long period of time has remained bearish, extending to the south after hitting a resistance around the $3.00 level. This in a way, highlights market participation, as the token seems to be solely controlled by the bears.
As it stands, the token’s price action around some critical levels would determine the next move; meanwhile, a bounce into the immediate resistance zone does not mean recovery but makes the market less bearish.
DOT/USDT Analysis: Is $1.850 the Turning Point?
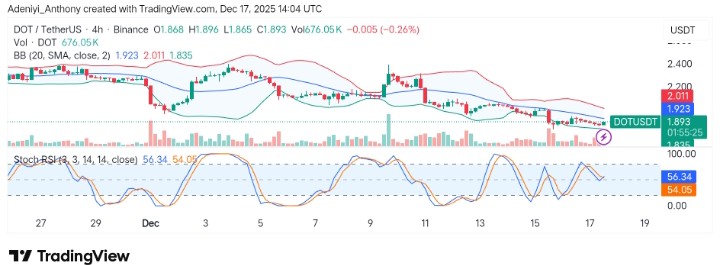
On the 4-hour chart, DOT/USDT appears to be bouncing off the lower Bollinger Band around the $1.85 support level. As it stands, the Stochastic RSI is currently at 56.34, with the price approaching $1.92.
To this end, if the price manages to break above this level, we could see a short-term bullish momentum pushing towards the $2.01 resistance as the momentum shows room for improvement.
You can purchase crypto coins here. Buy Crypto
