Tamadoge (TAMA/USD) Eyes Potential Rebound from the $0.00027 Level
Estimated Reading Time: 3 minutes
Don’t invest unless you’re prepared to lose all the money you invest. This is a high-risk investment and you are unlikely to be protected if something goes wrong. Take 2 minutes to learn more
In the most recent analysis of the Tamadoge (TAMA/USD) market, price action showed a decline to the $0.00029 level, followed by a brief phase of consolidation. Given the proximity to the critical $0.0003 psychological support, expectations were high for a bullish rebound from that zone.
However, bearish pressure intensified, leading to a fresh downward move that pushed the price lower. This forced bulls to regroup around the $0.00027 level—another key support zone. With renewed buying interest emerging at this point, the market has found temporary stability, and price action is now consolidating once again near $0.00027.
This consolidation suggests a short-term equilibrium between buyers and sellers. A decisive move above this range could signal the beginning of a potential recovery, while failure to hold this level may open the door to further downside pressure.
Key Price Zones to Watch
- Resistance: $0.00045, $0.00050, $0.00055
- Support: $0.00027, $0.00026, $0.00025

Tamadoge (TAMA/USD) Indicator Analysis—4-Hour Chart Outlook
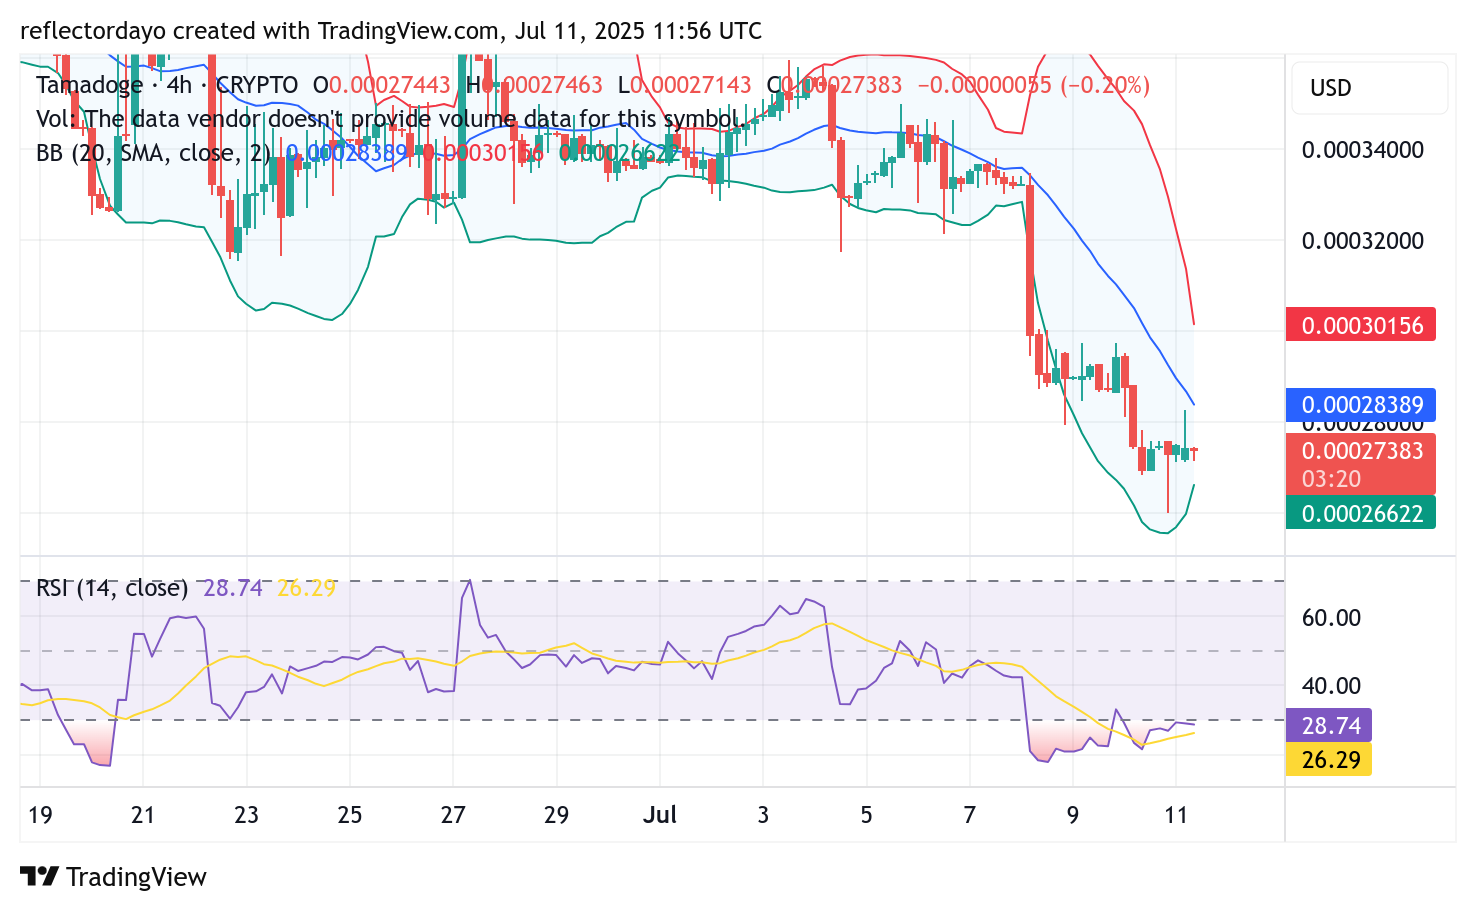
As the TAMA/USD price declined to the $0.00027 level, trader activity increased, leading to a consolidation phase around that zone. A closer look at key technical indicators on the 4-hour chart suggests that the Tamadoge market may be preparing for a potential rebound.
The Bollinger Bands show price action hugging the lower band, while the Relative Strength Index (RSI) is deep in oversold territory—both classic signs of bearish exhaustion. The prolonged consolidation near this support level further reinforces the likelihood that selling pressure may be weakening.
Although bearish sentiment remains present, the combination of oversold RSI readings and price stabilization around a critical support zone suggests that the market is potentially primed for a bounce in the near term.
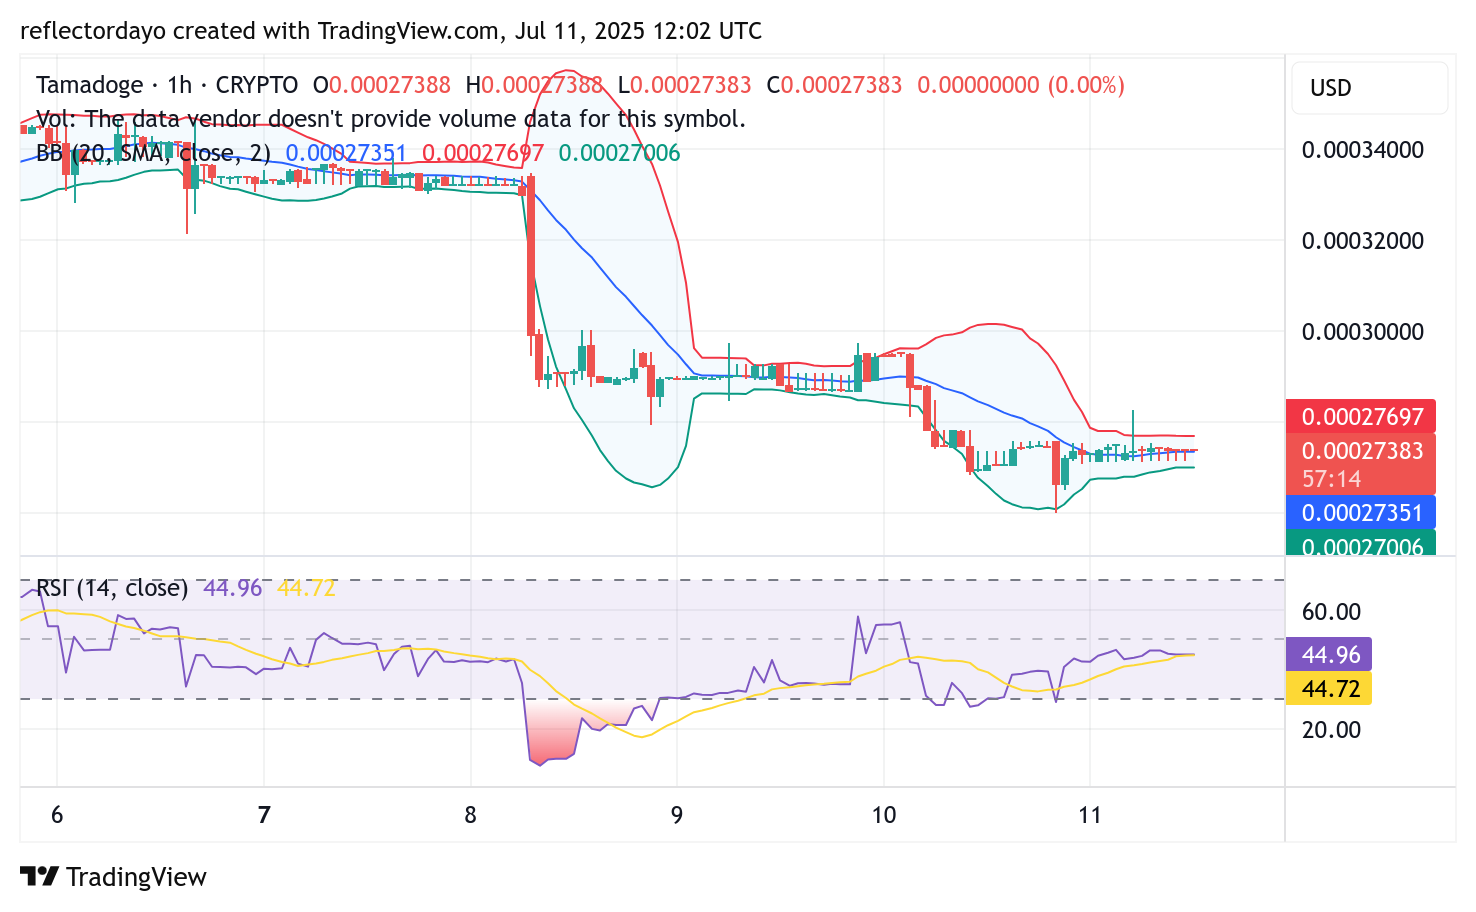
1-Hour Chart Analysis: Signs of Accumulation Amid Lingering Bearish Sentiment
On the smaller 1-hour timeframe, the market appears to be consolidating near the midpoint of the Relative Strength Index (RSI). With price action hovering around the 45 mark—just below the neutral 50 level—the sentiment remains cautiously bearish. However, the sideways movement suggests a period of accumulation, as the market seems to have reached a temporary standoff.
Although a clear directional move has yet to emerge, the RSI nearing oversold territory indicates a potential for upward momentum. Traders are closely watching this consolidation phase for signs of a breakout, with a slight bias toward a bullish reversal.
Buy Tamadoge!
There’s no mobile runner out there quite like #TamadogePursuit! 🏃♂️
1️⃣ Sign up – start with 20 free credits for a boost!
2️⃣ Climb up the leaderboards.
3️⃣ Win $TAMA rewards!Play Now! 👇
📱Android: https://t.co/Of8SYALRzL
📱 iOS: https://t.co/IthvqovwAH pic.twitter.com/84HNqob9Rf— TAMADOGE (@Tamadogecoin) September 10, 2024