Tamadoge (TAMA/USD) Eyes Potential Rebound from $0.00029
Estimated Reading Time: 3 minutes
Don’t invest unless you’re prepared to lose all the money you invest. This is a high-risk investment and you are unlikely to be protected if something goes wrong. Take 2 minutes to learn more
The Tamadoge (TAMA/USD) market has been consolidating around the $0.00034 level for some time, building expectations of an eventual bullish breakout toward the $0.00040 or even $0.00045 resistance zones. However, contrary to those expectations, the price broke to the downside instead.
Despite this unexpected move, the market is now exploring the possibility of a rebound from the lower support area near $0.00029. While the recent decline may have shaken bullish confidence, buyers appear to be watching this level closely for signs of a potential recovery.
Key Price Zones to Watch
- Resistance: $0.00045, $0.00050, $0.00055
- Support: $0.00029, $0.00028, $0.00026
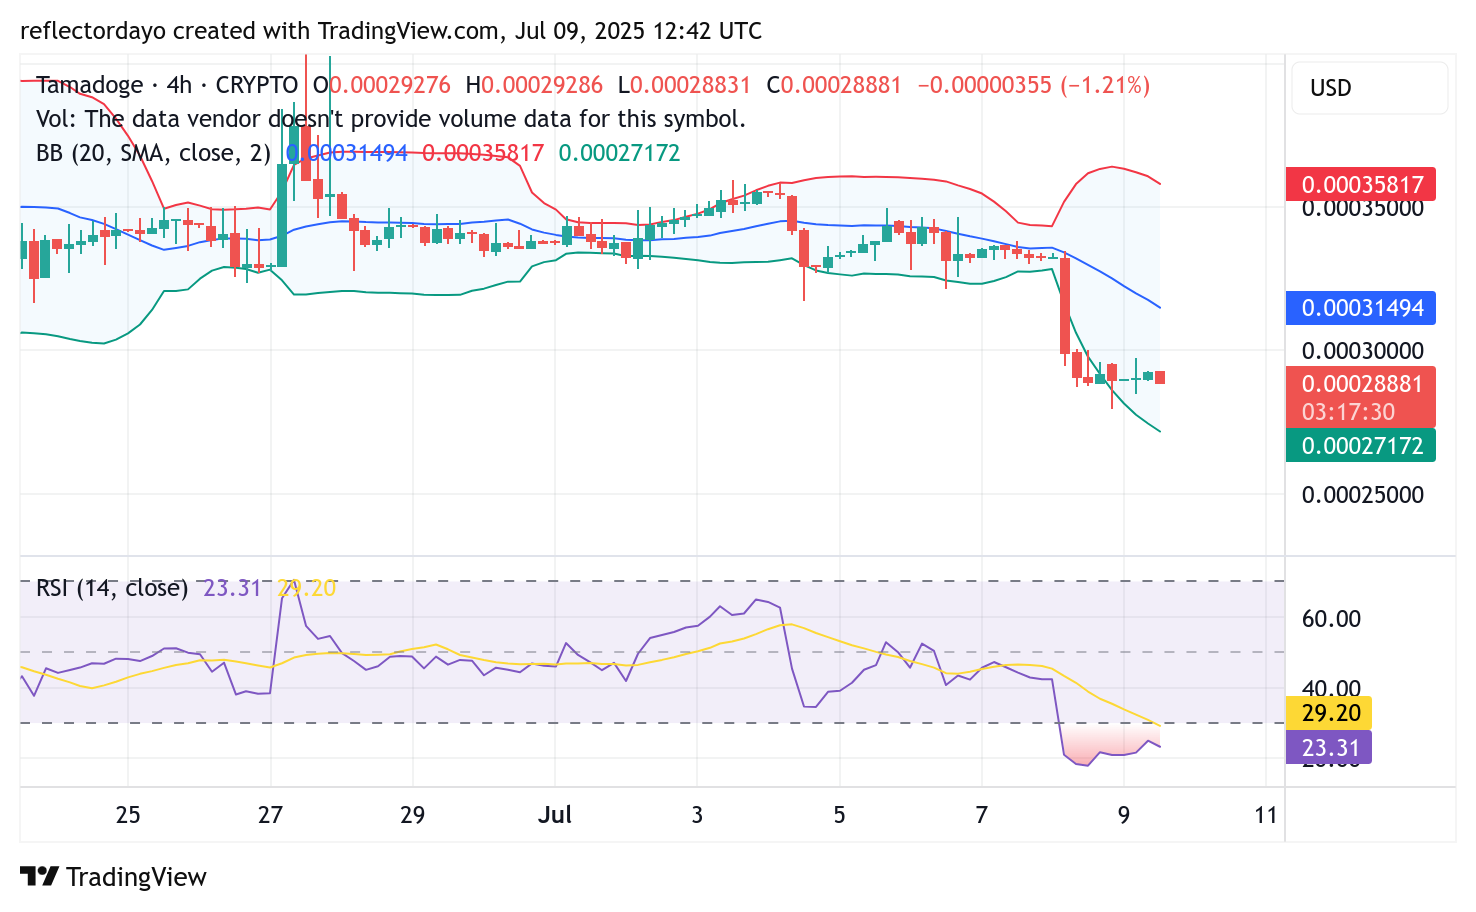
Tamadoge Indicator Analysis—4-Hour Chart Outlook
The Tamadoge (TAMA/USD) market recently broke below the $0.00034 level, triggering a wave of bearish pressure that drove prices sharply lower. The bearish momentum proved strong enough to overwhelm the bulls’ support at the $0.00030 zone, forcing buyers to regroup around the $0.00029 support level.
This breakdown from $0.00034 introduced heightened volatility, but with renewed bullish activity emerging between $0.00029 and $0.00030, the crypto signal appears to be stabilizing. Price action is currently consolidating within this range, signaling a potential setup for a bullish rebound.
The Relative Strength Index (RSI) supports this outlook, indicating that the market has entered oversold territory. This suggests that an upward correction may be imminent. Coupled with potential buying interest from traders looking to “buy the dip,” this technical setup could fuel a meaningful recovery in TAMA/USD in the near term.
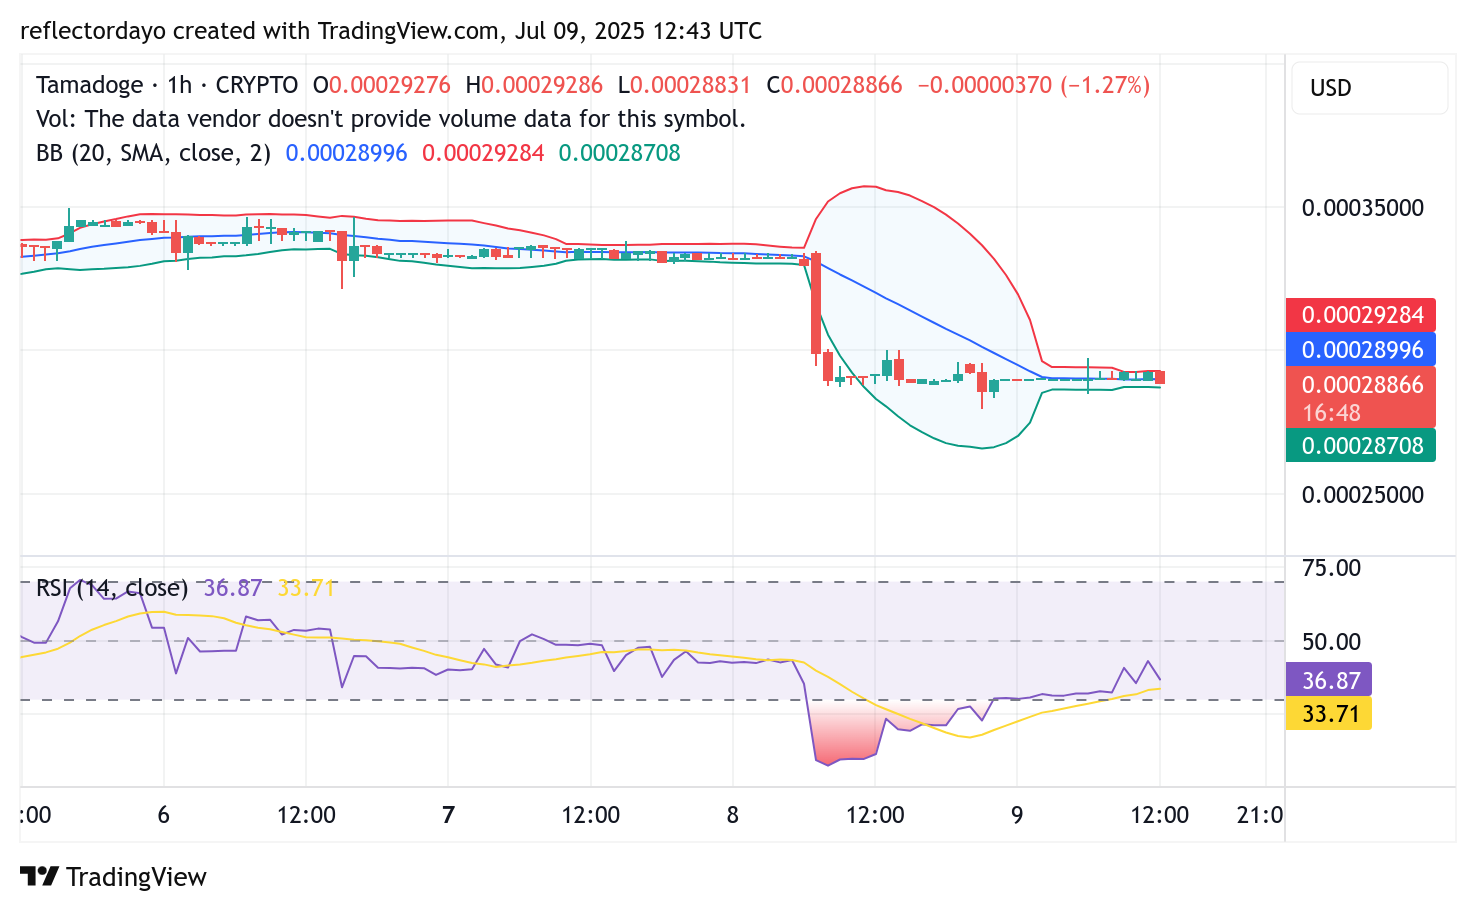
1-Hour Chart Analysis: Signs of Accumulation Amid Lingering Bearish Sentiment
On the 1-hour timeframe, early signs of accumulation are beginning to emerge. The chart suggests that some traders are gradually re-entering the market, leading to a slight upward shift in price action. This suggests growing interest from buyers at current levels.
However, despite this nascent recovery, the market is still grappling with the remnants of bearish sentiment, which is slowing down the pace of the rebound. As time progresses and selling pressure diminishes, there is potential for a clearer and more sustained bullish move to develop.
Buy Tamadoge!
There’s no mobile runner out there quite like #TamadogePursuit! 🏃♂️
1️⃣ Sign up – start with 20 free credits for a boost!
2️⃣ Climb up the leaderboards.
3️⃣ Win $TAMA rewards!Play Now! 👇
📱Android: https://t.co/Of8SYALRzL
📱 iOS: https://t.co/IthvqovwAH pic.twitter.com/84HNqob9Rf— TAMADOGE (@Tamadogecoin) September 10, 2024