Tamadoge (TAMA/USD) Bulls Regroup Around $0.00034 Support Zone
Estimated Reading Time: 4 minutes
Don’t invest unless you’re prepared to lose all the money you invest. This is a high-risk investment and you are unlikely to be protected if something goes wrong. Take 2 minutes to learn more
Following a recent bullish rally that briefly pushed TAMA/USD above the $0.00035 mark, bearish pressure swiftly returned, driving the price back down toward the $0.00033 level. Capitalizing on heightened market volatility, sellers triggered a notable correction in price action.
However, the bearish momentum was short-lived as bulls demonstrated resilience, defending the critical support zone and fueling a quick rebound back to the $0.00035 resistance level. Although the price faced another pullback after testing that high, a new support appears to be forming around $0.00034—a level that is beginning to show technical significance.
This emerging support suggests that buying interest remains active, and with the bulls regrouping at this zone, the market could be setting the stage for a breakout. If the $0.00034 level continues to hold firm, a renewed push above $0.00035 may follow, potentially triggering a broader upward move in the sessions ahead.
Key Price Zones to Watch
- Resistance: $0.00045, $0.00050, $0.00055
- Support: $0.00032, $0.00030, $0.00025
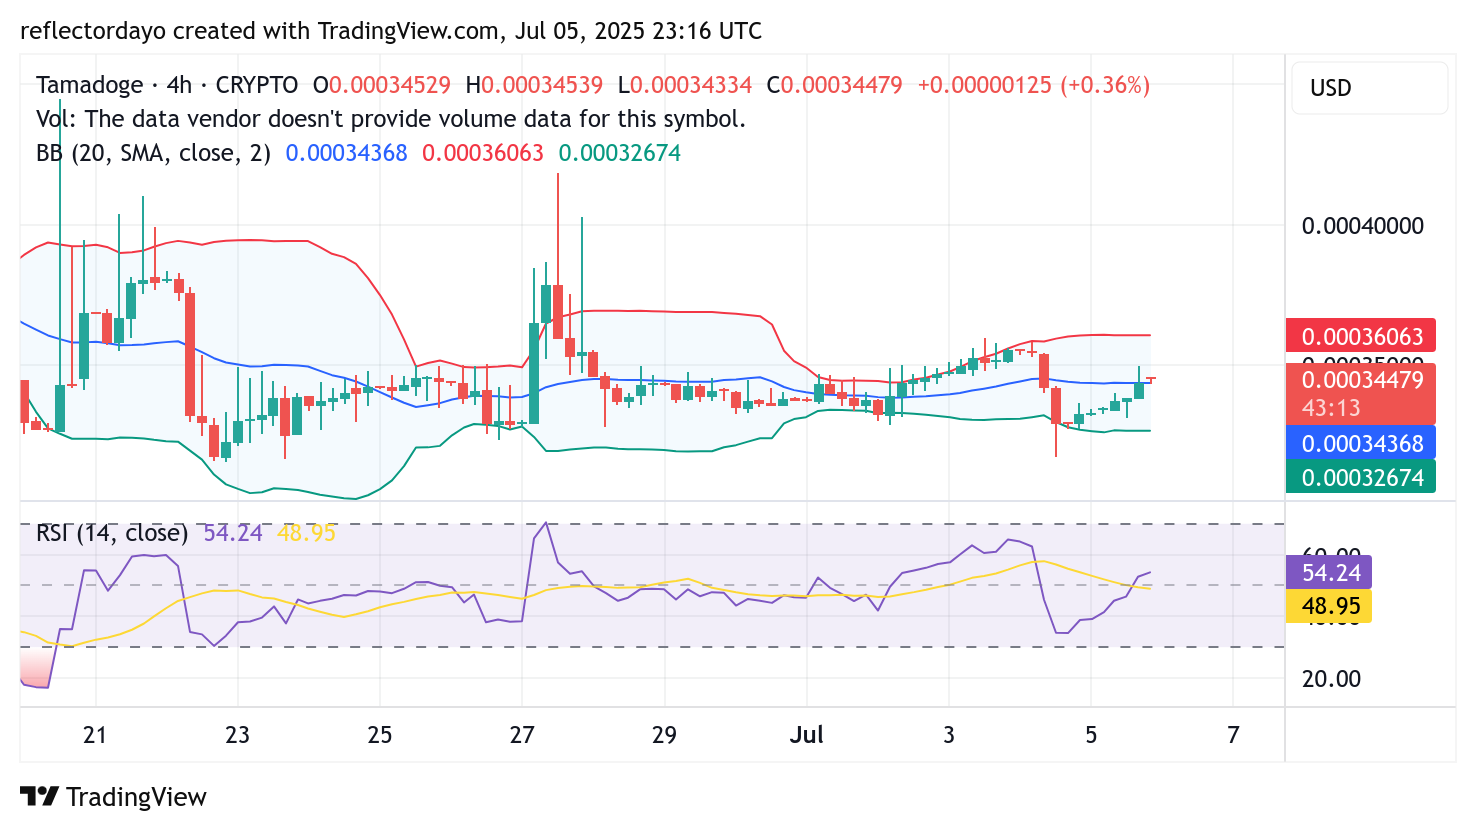
Indicator Analysis—4-Hour Chart Perspective: Momentum Builds as TAMA/USD Recovers from Recent Dip
The recent bearish wave in TAMA/USD was notably intense, as sellers capitalized on heightened market volatility to drive prices sharply lower. This selling pressure pushed the market down to the $0.00031 level—an area historically recognized as a buying zone. As expected, strong demand emerged at this level, triggering a sharp recovery that propelled the price back toward the key resistance at $0.00035.
Upon reaching the $0.00035 level, the price encountered renewed selling pressure, prompting a modest pullback. This reaction signals that bearish sentiment still lingers above the resistance zone. However, bullish resilience remains evident.
A notable technical signal is the formation of a four-price doji near the $0.00035 level. This pattern, which often indicates market indecision or a potential reversal, appears at the bottom of the recent correction and suggests that buyers are defending the newly established support zone.
With momentum gradually building and bulls showing persistent strength, the current setup hints at a possible breakout—provided the $0.00035 barrier is breached with conviction in the sessions ahead.
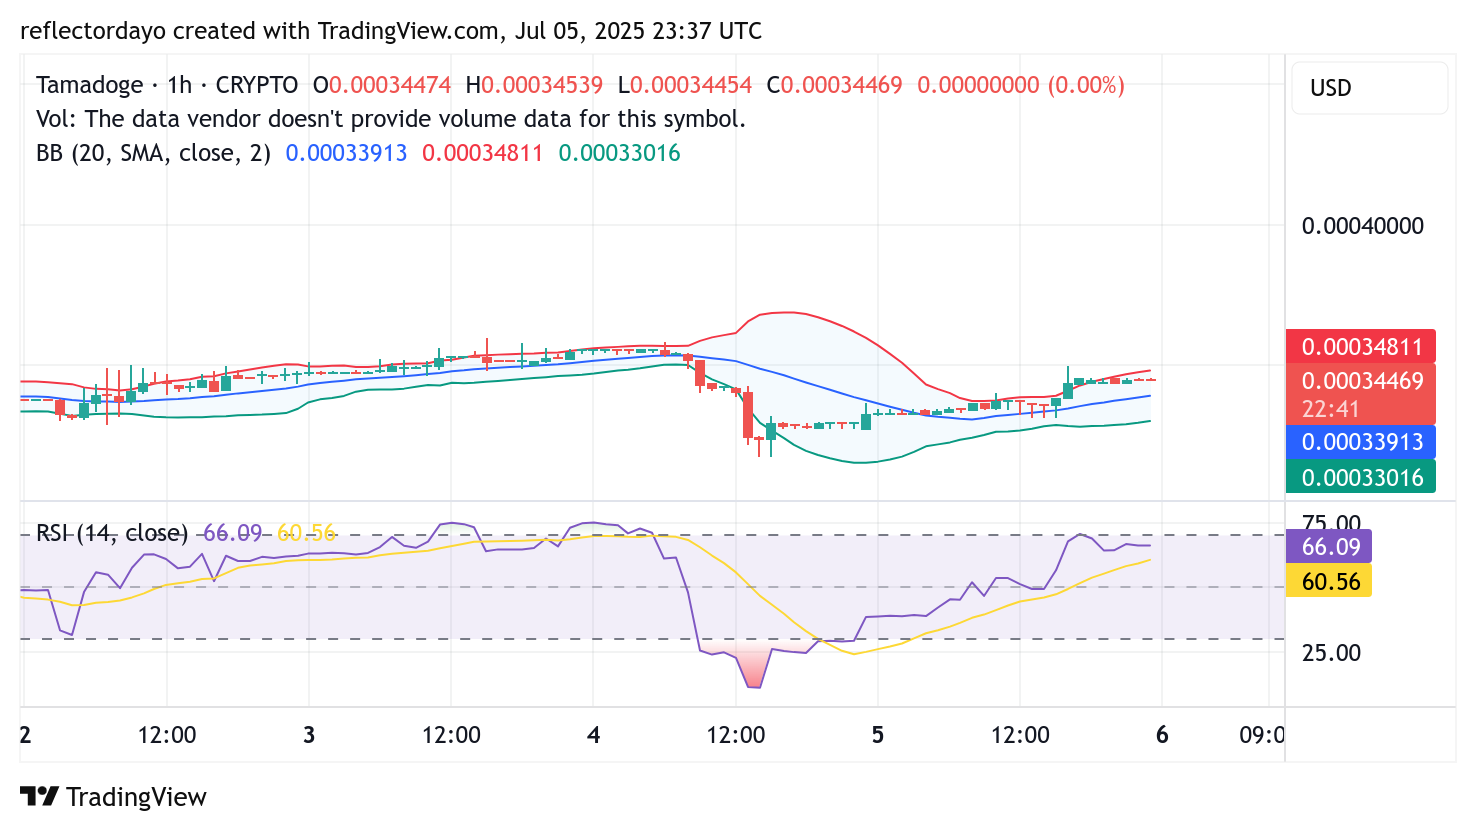
Tamadoge 1-Hour Chart Analysis: Overbought Conditions Signal Potential Short-Term Pullback
After a minor correction from the $0.00035 resistance level, the TAMA/USD market has entered a phase of relative equilibrium, with buying and selling pressures appearing evenly matched. This consolidation has persisted over the past several hourly sessions, reflecting a temporary pause in market momentum.
This balanced activity points to two key developments: a weakening of bearish momentum and a demonstration of bullish resilience. Despite recent downward pressure, buyers have managed to maintain a firm presence, preventing a deeper decline and keeping the price steady within a narrow range.
Given these conditions, a subtle upward movement above the $0.00035 mark appears increasingly likely, as bullish momentum gradually rebuilds. However, with the market approaching overbought territory, traders should also be cautious of a short-term pullback before any sustained breakout materializes.
Buy Tamadoge!
There’s no mobile runner out there quite like #TamadogePursuit! 🏃♂️
1️⃣ Sign up – start with 20 free credits for a boost!
2️⃣ Climb up the leaderboards.
3️⃣ Win $TAMA rewards!Play Now! 👇
📱Android: https://t.co/Of8SYALRzL
📱 iOS: https://t.co/IthvqovwAH pic.twitter.com/84HNqob9Rf— TAMADOGE (@Tamadogecoin) September 10, 2024