Tamadoge (TAMA/USD) Edges Back to $0.00035 as Bulls Regain Momentum
Estimated Reading Time: 3 minutes
Don’t invest unless you’re prepared to lose all the money you invest. This is a high-risk investment and you are unlikely to be protected if something goes wrong. Take 2 minutes to learn more
The Tamadoge (TAMA/USD) market has been trading in a tight range, caught between buying and selling pressure just below the key $0.00035 level—a notable pivot in recent sessions. However, recent price action signals a subtle shift in sentiment, with bulls beginning to reassert control.
This gradual upward movement has now brought the crypto signal back to $0.00035, where a four-price doji has formed just above the level—often a sign of market indecision and potential breakout buildup.
Let’s take a closer look at the indicators to assess the next likely direction.
Key Price Zones to Watch
- Resistance: $0.00045, $0.00050, $0.00055
- Support: $0.00032, $0.00030, $0.00025
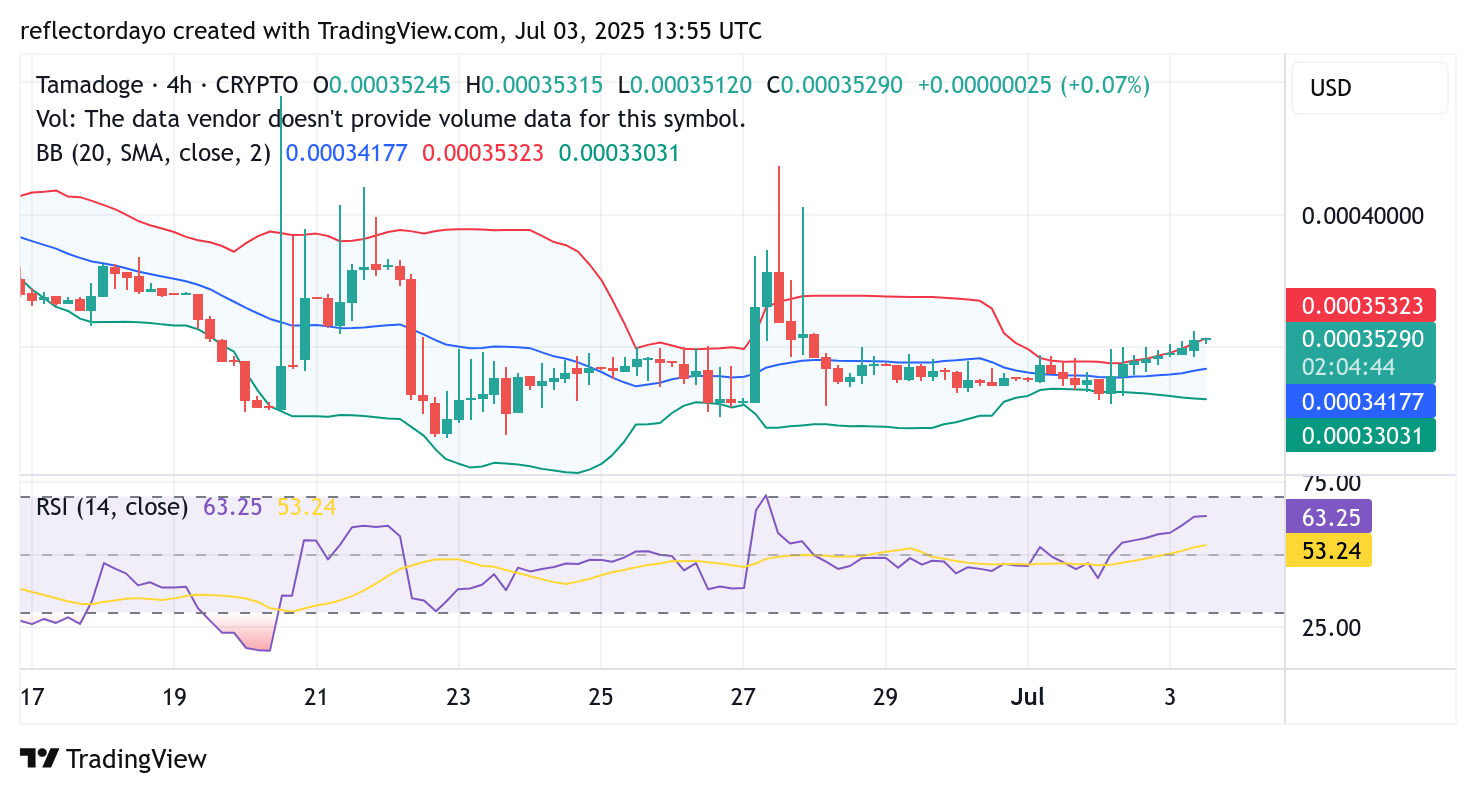
Indicator Analysis—4-Hour Chart Perspective: Momentum Builds as TAMA/USD Recovers from Recent Dip
On the 4-hour chart, a four-price doji has formed just above the $0.00035 level, indicating a phase of Tamadoge market indecision where buying and selling pressures are nearly balanced. This type of candlestick pattern often signals a potential shift or continuation depending on upcoming momentum.
Despite the temporary pause in upward movement, the Relative Strength Index (RSI) currently reads 63, suggesting that bullish momentum remains intact and that there is still room for further upward action before the market becomes overbought.
If the Tamadoge price breaks out from this current consolidation zone, the next potential upside target could be around the $0.0004 level, marking a continuation of the bullish recovery.
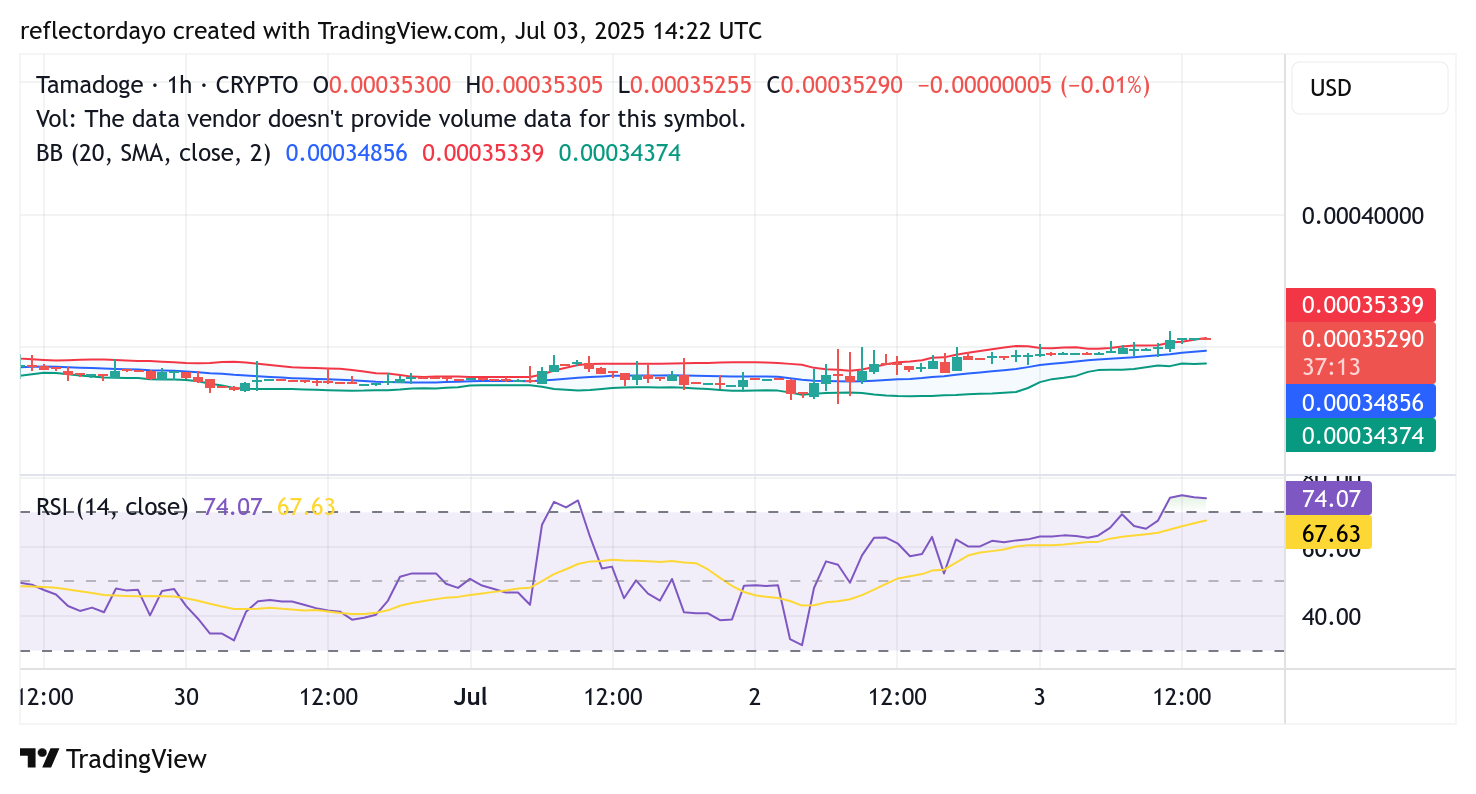
1-Hour Chart Analysis: Overbought Conditions Suggest Short-Term Pullback
On the 1-hour chart, TAMA/USD appears poised for a minor correction. Although the price is currently hovering around $0.000353, the Relative Strength Index (RSI) is signaling overbought conditions, indicating that a short-term retracement may be imminent.
A potential dip toward the $0.00035 support level could serve as a healthy correction before renewed bullish momentum drives the price toward the $0.0004 resistance zone.
Buy Tamadoge!
There’s no mobile runner out there quite like #TamadogePursuit! 🏃♂️
1️⃣ Sign up – start with 20 free credits for a boost!
2️⃣ Climb up the leaderboards.
3️⃣ Win $TAMA rewards!Play Now! 👇
📱Android: https://t.co/Of8SYALRzL
📱 iOS: https://t.co/IthvqovwAH pic.twitter.com/84HNqob9Rf— TAMADOGE (@Tamadogecoin) September 10, 2024