Bitcoin (BTC) Price Prediction: BTC/USDT May Resume Diving
Estimated Reading Time: 2 minutes
Don’t invest unless you’re prepared to lose all the money you invest. This is a high-risk investment and you are unlikely to be protected if something goes wrong. Take 2 minutes to learn more

Date: November 26, 2025
The Bitcoin market has seen some bullish recovery but still remains under considerable bearish sentiment. Given the technical stance of this market, it is safe to anticipate a bearish retracement rather than a bullish continuation. Be that as it may, let’s take a closer look at the market in more detail below.
BTC/USDT Long-Term Trend — Bearish (Daily Chart)
Key Price Levels
Resistance: $90,000, $95,000, $100,000
Support: $85,000, $80,000, $75,000
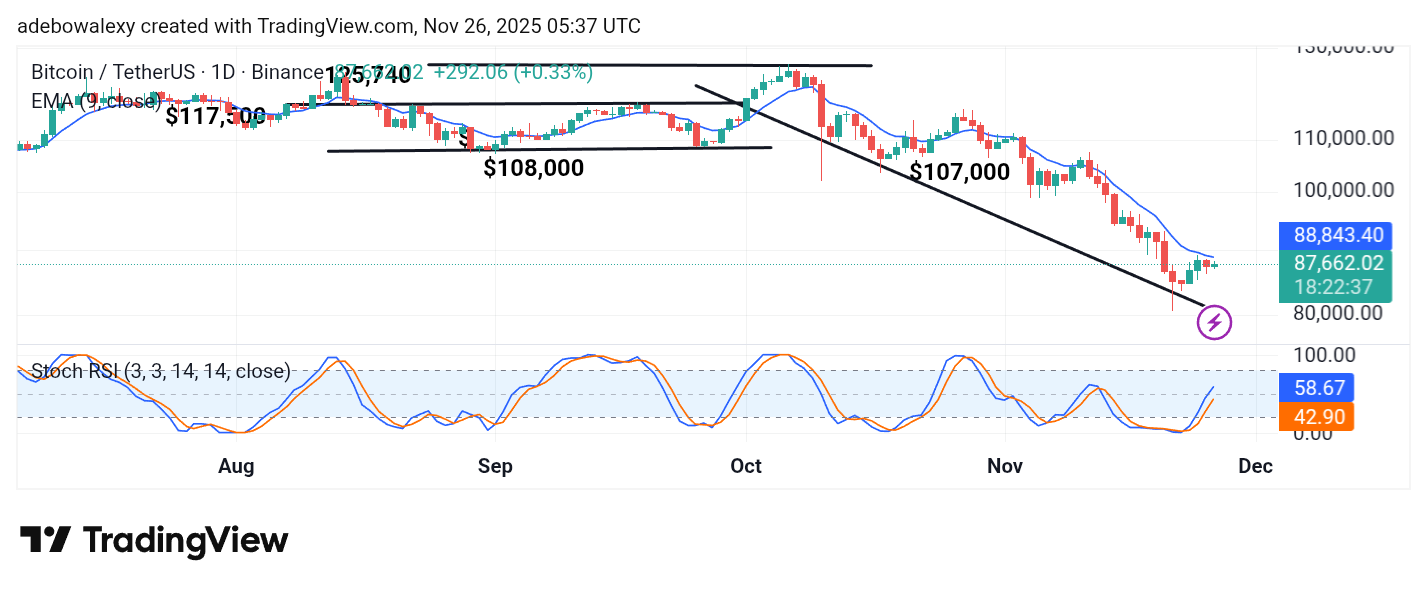
So far today, the Bitcoin market has seen some bearish retracement. The current session on the chart appears weakly bullish, represented by a small green price candle. Price action also stands below the 9-day Exponential Moving Average (EMA). Additionally, the Stochastic Relative Strength Index (SRSI) indicator lines are rising from the oversold region despite the dip seen in the ongoing session.
Bitcoin Price Prediction: BTC/USDT May Succumb Once More
Only modest price increases have been observed on the Bitcoin daily chart. The latest candle is a small green one, keeping price action hugging the 9-day EMA from below.
The lines of the Stochastic Relative Strength Index (SRSI) are rising faster than price action, which may signal an impending trend weakening. However, the most recent price candle still maintains some bullish hope. As such, traders may wait to see if price action will rise past the 9-day EMA before taking stronger bullish positions.
Bitcoin Price Prediction: BTC/USDT Bulls Trying to Advance the Market (4-Hour Chart)
The Bitcoin 4-hour chart shows the market pushing its way through the 9-day EMA. The ongoing session is represented by a green price candle that pokes through the 9-day EMA. This candle currently has no upper or lower shadow.
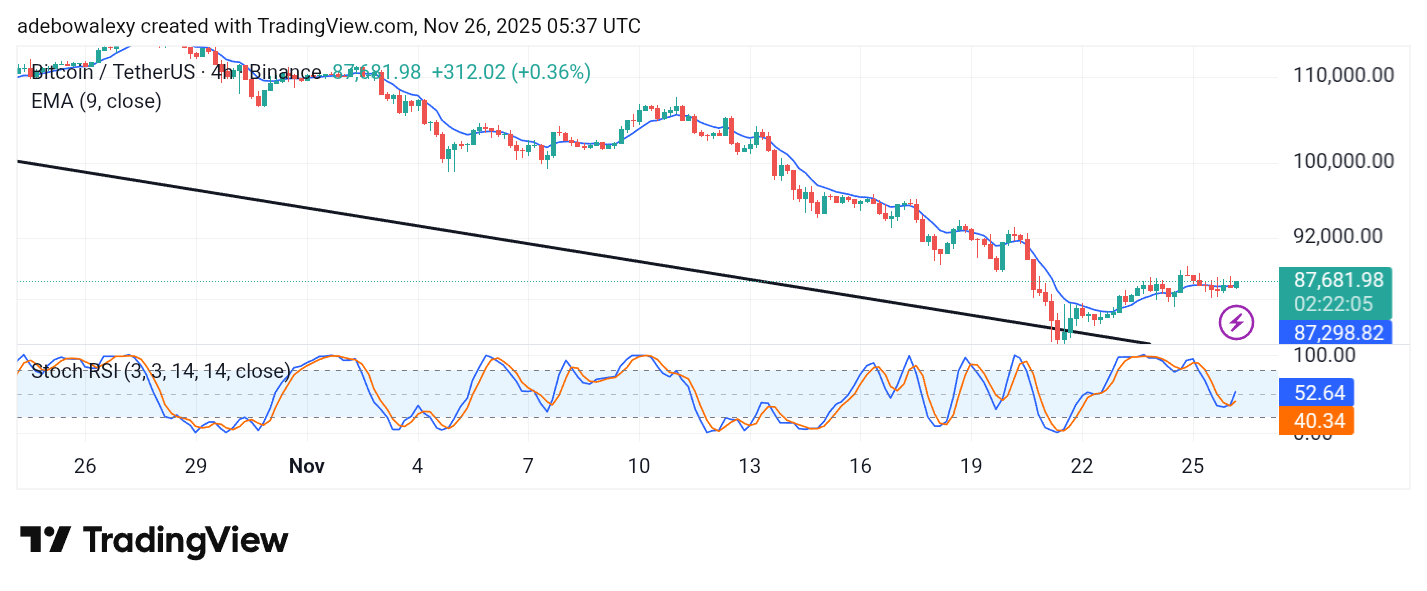
The market’s trajectory here seems slightly upward, aligning with the bullish crossover on the SRSI indicator. The SRSI lines are rising into the oversold region. Therefore, price action on this timeframe may edge toward the $90,000 level in the short term.