Polygon (POL) Price Prediction: POL/USDT Breaks Through the $0.4248 Resistance Level
Estimated Reading Time: 2 minutes
Don’t invest unless you’re prepared to lose all the money you invest. This is a high-risk investment and you are unlikely to be protected if something goes wrong. Take 2 minutes to learn more

Polygon (POL) Price Prediction: August 10
The Polygon market has managed to sustain trading above the $0.4000 mark. Furthermore, the past two sessions saw the market record a significant upside correction, bringing the market up to the $0.4248 price level.
POL/USDT Long-term Trend: Bullish (Daily Chart)
Key Price Levels:
Resistance Levels: $0.4500, $0.5000, and $0.6000
Support Levels: $0.4000, $0.3500, and $0.3000
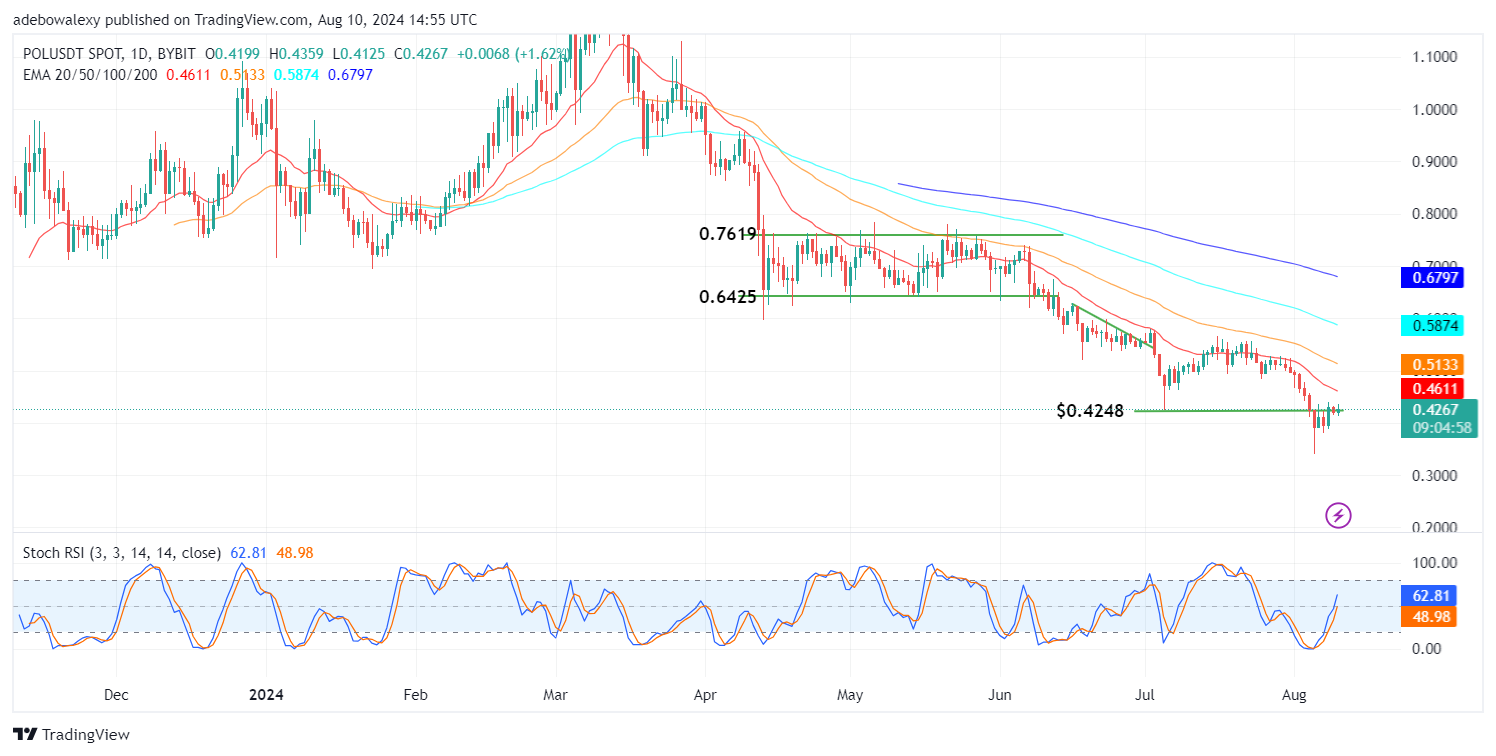
After reaching the mentioned resistance level, the market is yet gain significant traction. Consequently, it remains below all the Exponential Moving Average (EMA) lines. Meanwhile, the Stochastic Relative Strength Index (SRSI) indicator lines maintain a steep upward trajectory. The last price candle on this chart has placed the token’s price above the $0.4248 resistance level by only a small margin.
Polygon Price Prediction: POL/USDT May Still See Additional Increases
As mentioned, the Polygon market has experienced some upside correction. While the market has yet to convincingly rise above the broken resistance level, price action remains below the EMA curves.
However, the SRSI indicator lines continue to rise, with the leading line already surpassing the 50 mark. Indications from this market suggest that the price may move further upward towards the $0.4600 mark.
Polygon Price Prediction: The POL/USDT Market Faces Strong Resistance at the 50-Day EMA (4H Chart)
Extending this price analysis to the 4-hour market, it can be observed that the ongoing session seems to have settled above the $0.4248 mark. Additionally, price action has risen past the 20-day EMA curve.
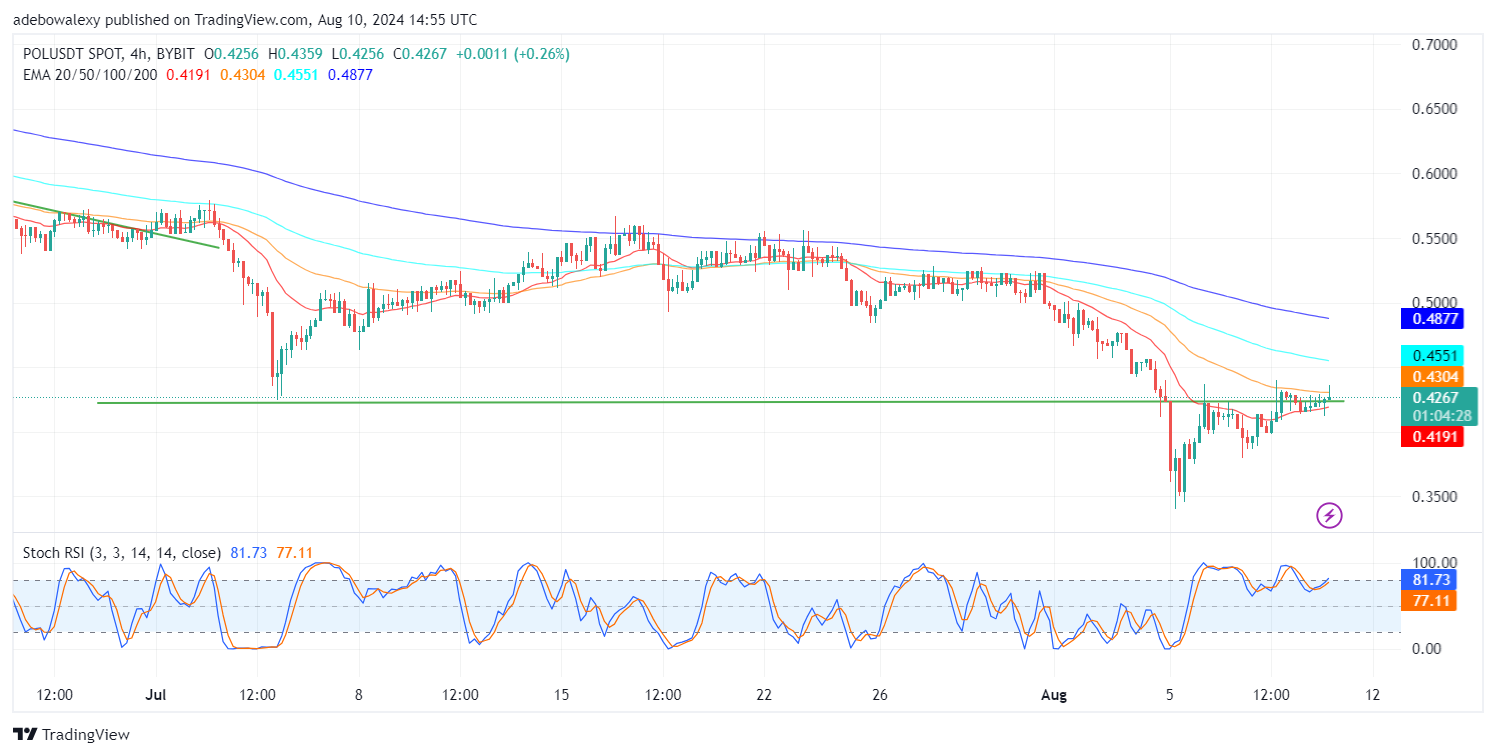
However, the 50-day EMA curve has presented strong resistance to further upward progress, resulting in a downward contraction in the session. The SRSI indicator lines continue to rise into the overbought region. Based on indications from this market, traders should anticipate only short-term gains towards the $0.4500 mark.