Cardano (ADA/USDT) at Crossroads: Is it Trend Continuation or Breakdown from Weekly Compression?
Estimated Reading Time: 3 minutes
Don’t invest unless you’re prepared to lose all the money you invest. This is a high-risk investment and you are unlikely to be protected if something goes wrong. Take 2 minutes to learn more
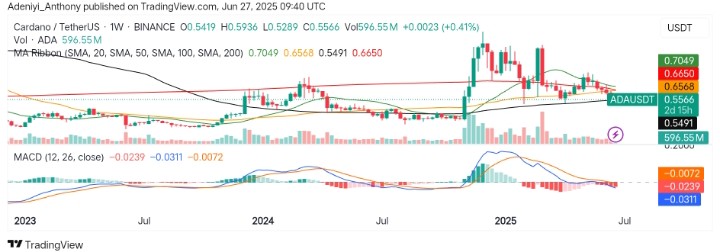
ADA Long-term Analysis: Ranging
Cardano against the Tether is trading in a compressed range between major moving averages on the weekly chart, signaling a phase of indecision. However, the bulls are losing momentum after failing to sustain above $0.7000, while the bears are yet to show strong dominance.
To this end, the market is cautiously neutral to bearish, with prices coiling near the $0.500 level, hoping to break in either direction.
Currently, Cardano trades at $0.5566 with 596.55 million weekly traded volumes.
Technical Indicators
Major Resistance Levels: $0.6568, $0.6650, and $0.7049
Major Support Levels: $0.5491, $0.5000, and $0.4200
Cardano Technical Analysis
The analysis of Cardano against the Tether on the weekly timeframe shows the pair is currently moving within a tight price range after dropping below $0.7000 in recent trades. However, MACD suggests neutral to bearish signals as the histogram shows reduced downward momentum.
On the other hand, the moving averages are acting as resistances except for the 100 SMA with a gradually declining volume. This indicates a reduced volatility in the weekly timeframe.
To this end, a bullish breakout above $0.6568 could target $0.7000 and above; otherwise, a bearish breakdown below $0.5491 opens a move to $0.50–$0.42.
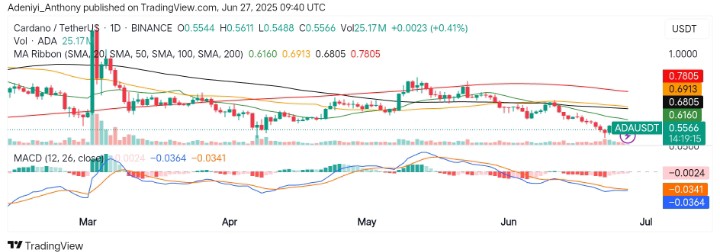
ADA/USDT Analysis: Expectations
On the daily chart, ADA/USDT is trading below all major daily SMAs, confirming a short-term bearish structure. However, the price is attempting to stabilize near $0.5566, but the 100-day SMA at $0.6160 remains firm resistance.
Also, the MACD lines are flat and below zero, signaling bearish pressure but a stable momentum. However, the histogram bars appear to be fading, suggesting a potential consolidation or pause in selling, while the volume remains relatively stable, offering no conviction for immediate reversal.
As it stands, the pair operates below crucial resistances between $0.6160 and $0.6805 and near-term support sitting around $0.5500.
To this end, if the buyers can reclaim $0.6160 with strong volume, a relief rally could initiated; otherwise, the downtrend may resume.
You can purchase crypto coins here. Buy LBlock