Cardano (ADA/USDT) Approaches Key Decision Zone: Can the Mid-term Bullish Structure Hold?
Estimated Reading Time: 3 minutes
Don’t invest unless you’re prepared to lose all the money you invest. This is a high-risk investment and you are unlikely to be protected if something goes wrong. Take 2 minutes to learn more
ADA/USDT Long-term Analysis: Bearish
Cardano against the Tether has been exhibiting signs of indecision as it consolidates near a critical support level. The price is currently hovering above the 100-period moving average with the volumes below the previous volume bar and weakening momentum.
Recently, the pair appears to have followed a strong impulse rally that now seems to be cooling off. However, the bears are beginning to test key moving averages, but the bulls seem to be defending long-term support as the Stochastic RSI extends lines to the south.
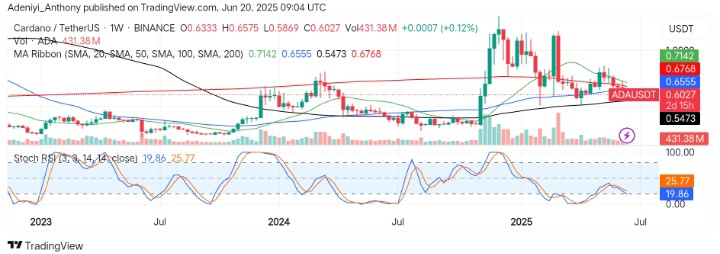
Currently, Cardano trades at $0.6027, recording over 431 million traded volumes for the week.
Technical Indicators
Major Resistance Levels: $0.6555, $0.7142, and $1.0000
Major Support Levels: $0.5473, $0.4920, and $0.4280
Cardano Technical Analysis
The analysis of Cardano against the Tether on the weekly chart show that the pair’s price appears to be oscillating between key moving averages. However, the recent drop below the 50-week moving averages shows the activeness of the bears as the bulls hope to defend the 100-period moving line at $0.5473 as the market faces low buying volume.
On the other hand, the Stochastic RSI indicates the pair is oversold. However, current positioning suggests a crossover might be seen if activities increase.
To this end, if the pair can reclaim the $0.6555, the market may return to its bullish ways; otherwise, a close below the immediate support would signal a short-term retracement.
ADA/USDT Analysis: Expectation
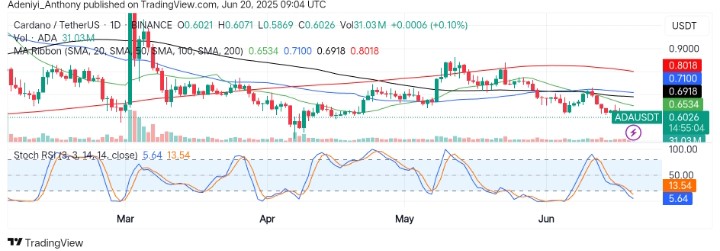
On the daily timeframe, ADA/USDT holds below the moving averages ribbon, signaling short-term bearish momentum, increasing the risk of more downtrend as the current volume condition is unconvincing.
Despite bullish involvement for the day, the Stochastic oscillator appears to be extremely oversold, presenting a possibility of a continued downtrend if the bulls fail.
As it stands, if the bulls allow a close below $0.5900, a sell-off could be triggered towards $0.5473. Conversely, any bounce to the upside could initiate a relief rally back toward $0.6700.
You can purchase crypto coins here. Buy LBlock